reference: pyplot 공식 Document 살펴보기
1
2
3
import matplotlib.pyplot as pltimport pandas as pdimport numpy as np
1. 밑 그림 그리기
plt.plot (df_name )plt.show()
1 2 3 4 5 6 7 8 data = np.arange(1 , 100 ) plt.plot(data) plt.show()
여러 그래프를 같은 canvas 안에 그리기: plt.plot(df_name) 를 연속 사용새 그래프를 새로운 canvas 안에 그리기: plt.figure()명령어를 추가
(1) 1개의 canvas 안에 다중 그래프 그리기
1
2
3
4
5
6
7
8
9
data1 = np.arange(1 , 51 ) data2 = np.arange(51 , 101 ) plt.plot(data1) plt.plot(data2) plt.plot(data2 + 50 ) plt.show()
(2) 새로운 canvas에서 새 그래프를 그리기
figure()는 새로운 그래프 canvas를 생성한다
1
2
3
4
5
6
7
8
9
10
data1 = np.arange(100 , 201 ) data2 = np.arange(200 , 301 ) plt.plot(data) plt.figure() plt.plot(data2) plt.plot(data2 + 50 ) plt.show()
여러 개 plot을 지정된 행,열수에 따라 배열해주기:
plt.subplot(row, column, index) # 각 plot의 좌표 설정
plt.subplots(행의 갯수, 열의 갯수) # 행,열수 설정
(1) subplot (plot의 좌표를 설정하기)
이 방법은 그래프마다 설정 해줘야 함
plt.subplot (row, column, index) # 콤마를 제거해도 됨
1
2
3
4
5
6
7
8
9
data1 = np.arange(100 , 201 ) plt.subplot(2 , 1 , 1 ) plt.plot(data1) data2 = np.arange(200 , 301 ) plt.subplot(2 , 1 , 2 ) plt.plot(data2) plt.show()
위의 코드와 동일하나, "콤마"를 제거한 상태
1
2
3
4
5
6
7
8
9
data1 = np.arange(100 , 201 ) plt.subplot(211 ) plt.plot(data1) data2 = np.arange(200 , 301 ) plt.subplot(212 ) plt.plot(data2) plt.show()
1
2
3
4
5
6
7
8
9
10
11
12
13
data1 = np.arange(100 , 201 ) plt.subplot(1 , 3 , 1 ) plt.plot(data1) data2 = np.arange(200 , 301 ) plt.subplot(1 , 3 , 2 ) plt.plot(data2) data3 = np.arange(300 , 401 ) plt.subplot(1 , 3 , 3 ) plt.plot(data3) plt.show()
(2) subplots (배열 기준인 행,열수를 지정하기)
subplot와 다르게 subplots()명령어는 한번만 설정 해주면 됨
plt.subplots (행의 갯수, 열의 갯수)
1
2
3
4
5
6
7
8
9
10
11
12
13
14
15
data = np.arange(1 , 51 ) fig, axes = plt.subplots(2 , 3 ) axes[0 , 0 ].plot(data) axes[0 , 1 ].plot(data * data) axes[0 , 2 ].plot(data ** 3 ) axes[1 , 0 ].plot(data % 10 ) axes[1 , 1 ].plot(-data) axes[1 , 2 ].plot(data // 20 ) plt.tight_layout() plt.show()
2. 주요 스타일 옵션 1 2 3 4 from IPython.display import ImageImage('https://matplotlib.org/_images/anatomy.png' )
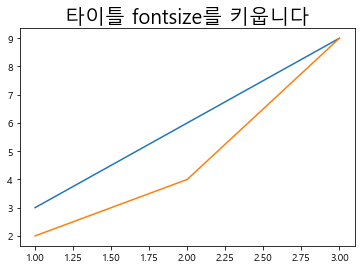
타이틀 추가: plt.title("…")타이틀 fontsize 설정: plt.title("…", fontsize = … )
1 2 3 4 plt.plot([1 ,2 ,3 ], [3 ,6 ,9 ]) plt.plot([1 ,2 ,3 ], [2 ,4 ,9 ]) plt.title("이것은 타이틀 입니다" )
Text(0.5, 1.0, '이것은 타이틀 입니다')
1 2 3 4 plt.plot([1 ,2 ,3 ], [3 ,6 ,9 ]) plt.plot([1 ,2 ,3 ], [2 ,4 ,9 ]) plt.title("타이틀 fontsize를 키웁니다" , fontsize = 20 )
Text(0.5, 1.0, '타이틀 fontsize를 키웁니다')
plt.xlabel ( “x_name ”, fontsize = …)plt.ylabel ( “y_name ”, fontsize = …)
1 2 3 4 5 6 7 8 9 plt.plot([1 ,2 ,3 ], [3 ,6 ,9 ]) plt.plot([1 ,2 ,3 ], [2 ,4 ,9 ]) plt.title("Label 설정 예제" , fontsize = 16 ) plt.xlabel("X축" , fontsize = 16 ) plt.ylabel("Y축" , fontsize = 16 )
Text(0, 0.5, 'Y축')
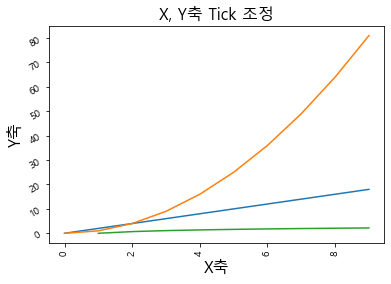
Tick은 X, Y축에 위치한 눈금을 말한다
plt.xticks ( rotation = … )plt.yticks ( rotation = … )역시개방향 회전각도 를 말한다
1 2 3 4 5 6 7 8 9 10 11 12 13 14 plt.plot(np.arange(10 ), np.arange(10 )*2 ) plt.plot(np.arange(10 ), np.arange(10 )**2 ) plt.plot(np.arange(10 ), np.log(np.arange(10 ))) plt.title("X, Y축 Tick 조정" , fontsize = 16 ) plt.xlabel("X축" , fontsize = 16 ) plt.ylabel("Y축" , fontsize = 16 ) plt.xticks(rotation = 90 ) plt.yticks(rotation = 30 )
D:\Anaconda\lib\site-packages\ipykernel_launcher.py:3: RuntimeWarning: divide by zero encountered in log
This is separate from the ipykernel package so we can avoid doing imports until
(array([-10., 0., 10., 20., 30., 40., 50., 60., 70., 80., 90.]),
<a list of 11 Text yticklabel objects>)
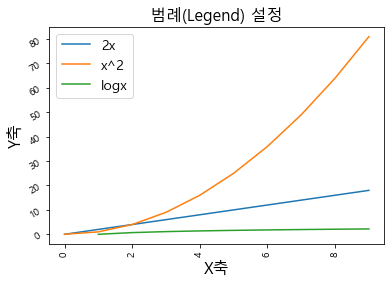
plt.legend ( [ “name1 ” , “name2 ” , … ], fontsize = …)
1 2 3 4 5 6 7 8 9 10 11 12 13 14 15 16 17 plt.plot(np.arange(10 ), np.arange(10 )*2 ) plt.plot(np.arange(10 ), np.arange(10 )**2 ) plt.plot(np.arange(10 ), np.log(np.arange(10 ))) plt.title("범례(Legend) 설정" , fontsize = 16 ) plt.xlabel("X축" , fontsize = 16 ) plt.ylabel("Y축" , fontsize = 16 ) plt.xticks(rotation = 90 ) plt.yticks(rotation = 30 ) plt.legend(["2x" , "x^2" , "logx" ], fontsize = 14 )
D:\Anaconda\lib\site-packages\ipykernel_launcher.py:3: RuntimeWarning: divide by zero encountered in log
This is separate from the ipykernel package so we can avoid doing imports until
<matplotlib.legend.Legend at 0x173a5712888>
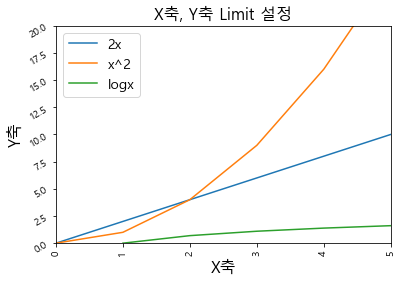
plt.xlim ( a, b )plt.ylim ( c, d )
1 2 3 4 5 6 7 8 9 10 11 12 13 14 15 16 17 18 19 20 21 plt.plot(np.arange(10 ), np.arange(10 )*2 ) plt.plot(np.arange(10 ), np.arange(10 )**2 ) plt.plot(np.arange(10 ), np.log(np.arange(10 ))) plt.title("X축, Y축 Limit 설정" , fontsize = 16 ) plt.xlabel("X축" , fontsize = 16 ) plt.ylabel("Y축" , fontsize = 16 ) plt.xticks(rotation = 90 ) plt.yticks(rotation = 30 ) plt.legend(["2x" , "x^2" , "logx" ], fontsize = 14 ) plt.xlim(0 , 5 ) plt.ylim(0 , 20 )
D:\Anaconda\lib\site-packages\ipykernel_launcher.py:3: RuntimeWarning: divide by zero encountered in log
  This is separate from the ipykernel package so we can avoid doing imports until

(0, 20)
reference: 세부 Document 확인하기
스타일 세부 설정은 마커, 선의 동류 설정, 드리고 컬러가 있으며, 문다열로 세부설정을 하게 된다
(1) marker의 종류
‘.’ point marker
‘,’ pixel marker
‘o’ circle marker
‘v’ triangle_down marker
‘^’ triangle_up marker
‘<’ triangle_left marker
‘>’ triangle_right marker
‘1’ tri_down marker
‘2’ tri_up marker
‘3’ tri_left marker
‘4’ tri_right marker
's ’ square marker
‘p’ pentagon marker
‘*’ star marker
‘h’ hexagon1 marker
‘H’ hexagon2 marker
‘+’ plus marker
‘x’ x marker
‘D’ diamond marker
‘d’ thin_diamond marker
‘|’ vline marker
‘_’ hline marker
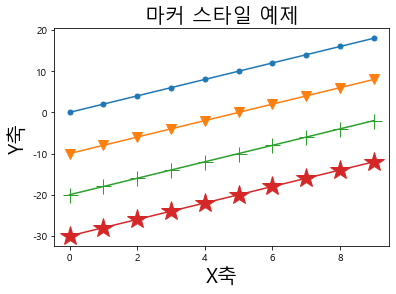
1 2 3 4 5 6 7 8 9 10 11 12 plt.plot(np.arange(10 ), np.arange(10 )*2 , marker='o' , markersize=5 ) plt.plot(np.arange(10 ), np.arange(10 )*2 - 10 , marker='v' , markersize=10 ) plt.plot(np.arange(10 ), np.arange(10 )*2 - 20 , marker='+' , markersize=15 ) plt.plot(np.arange(10 ), np.arange(10 )*2 - 30 , marker='*' , markersize=20 ) plt.title('마커 스타일 예제' , fontsize=20 ) plt.xlabel('X축' , fontsize=20 ) plt.ylabel('Y축' , fontsize=20 )
Text(0, 0.5, 'Y축')
(2) line의 종류
‘-’ solid line style
‘–’ dashed line style
‘-.’ dash-dot line style
‘:’ dotted line style
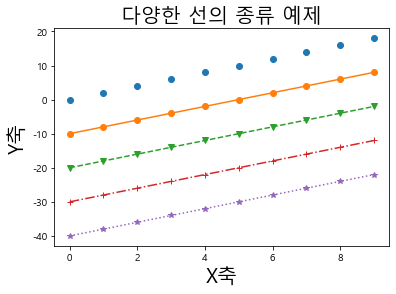
1 2 3 4 5 6 7 8 9 10 11 12 13 plt.plot(np.arange(10 ), np.arange(10 )*2 , marker='o' , linestyle='' ) plt.plot(np.arange(10 ), np.arange(10 )*2 - 10 , marker='o' , linestyle='-' ) plt.plot(np.arange(10 ), np.arange(10 )*2 - 20 , marker='v' , linestyle='--' ) plt.plot(np.arange(10 ), np.arange(10 )*2 - 30 , marker='+' , linestyle='-.' ) plt.plot(np.arange(10 ), np.arange(10 )*2 - 40 , marker='*' , linestyle=':' ) plt.title('다양한 선의 종류 예제' , fontsize=20 ) plt.xlabel('X축' , fontsize=20 ) plt.ylabel('Y축' , fontsize=20 )
Text(0, 0.5, 'Y축')
(3) color의 종류
‘b’ blue
‘g’ green
‘r’ red
‘c’ cyan
‘m’ magenta
‘y’ yellow
‘k’ black
‘w’ white
more choices: matplotlib.colors (e.g. “purple”, “#008000”)
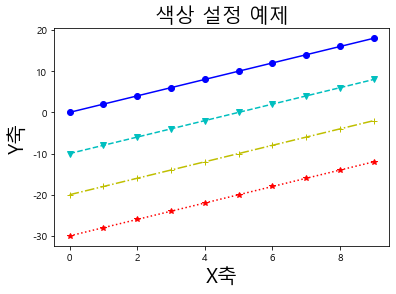
1 2 3 4 5 6 7 8 9 10 11 12 plt.plot(np.arange(10 ), np.arange(10 )*2 , marker='o' , linestyle='-' , color='b' ) plt.plot(np.arange(10 ), np.arange(10 )*2 - 10 , marker='v' , linestyle='--' , color='c' ) plt.plot(np.arange(10 ), np.arange(10 )*2 - 20 , marker='+' , linestyle='-.' , color='y' ) plt.plot(np.arange(10 ), np.arange(10 )*2 - 30 , marker='*' , linestyle=':' , color='r' ) plt.title('색상 설정 예제' , fontsize=20 ) plt.xlabel('X축' , fontsize=20 ) plt.ylabel('Y축' , fontsize=20 )
Text(0, 0.5, 'Y축')
(4) Format: '[marker][line][color]'
example:
‘b’ # blue markers with default shape
‘or’ # red circles
‘-g’ # green solid line
‘–’ # dashed line with default color
‘^k:’ # black triangle_up markers connected by a dotted line
Each of them is optional. If not provided, the value from the style cycle is used. Exception: If line is given, but no marker, the data will be a line without markers.
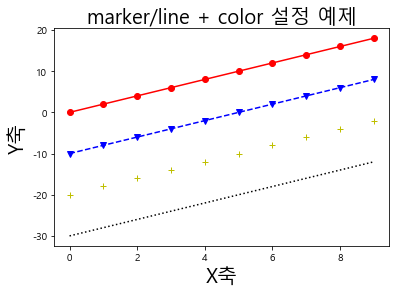
1 2 3 4 5 6 7 8 9 10 11 12 plt.plot(np.arange(10 ), np.arange(10 )*2 , "o-r" ) plt.plot(np.arange(10 ), np.arange(10 )*2 - 10 , 'v--b' ) plt.plot(np.arange(10 ), np.arange(10 )*2 - 20 , '+y' ) plt.plot(np.arange(10 ), np.arange(10 )*2 - 30 , ':k' ) plt.title('marker/line + color 설정 예제' , fontsize=20 ) plt.xlabel('X축' , fontsize=20 ) plt.ylabel('Y축' , fontsize=20 )
Text(0, 0.5, 'Y축')
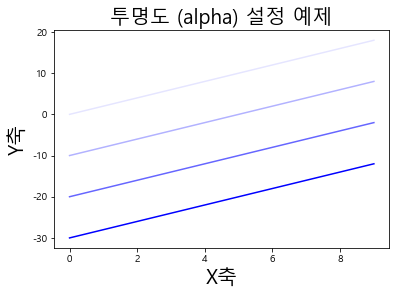
(5) 색상 투명도 설정
1 2 3 4 5 6 7 8 9 10 11 12 plt.plot(np.arange(10 ), np.arange(10 )*2 , color='b' , alpha=0.1 ) plt.plot(np.arange(10 ), np.arange(10 )*2 - 10 , color='b' , alpha=0.3 ) plt.plot(np.arange(10 ), np.arange(10 )*2 - 20 , color='b' , alpha=0.6 ) plt.plot(np.arange(10 ), np.arange(10 )*2 - 30 , color='b' , alpha=1.0 ) plt.title('투명도 (alpha) 설정 예제' , fontsize=20 ) plt.xlabel('X축' , fontsize=20 ) plt.ylabel('Y축' , fontsize=20 )
Text(0, 0.5, 'Y축')
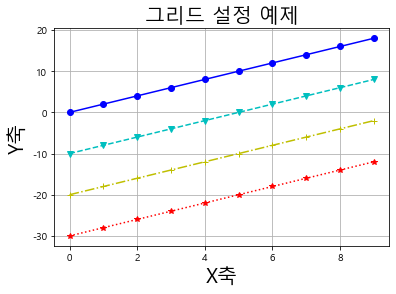
그리드 (grid) 추가: plt.grid()
1 2 3 4 5 6 7 8 9 10 11 12 13 14 plt.plot(np.arange(10 ), np.arange(10 )*2 , marker='o' , linestyle='-' , color='b' ) plt.plot(np.arange(10 ), np.arange(10 )*2 - 10 , marker='v' , linestyle='--' , color='c' ) plt.plot(np.arange(10 ), np.arange(10 )*2 - 20 , marker='+' , linestyle='-.' , color='y' ) plt.plot(np.arange(10 ), np.arange(10 )*2 - 30 , marker='*' , linestyle=':' , color='r' ) plt.title('그리드 설정 예제' , fontsize=20 ) plt.xlabel('X축' , fontsize=20 ) plt.ylabel('Y축' , fontsize=20 ) plt.grid()


