Blending Multiple Data Sources
- 1. Data Blending
- 2. Blending Your Data
* - 3. Left Join VS Blending
- 4. Blending Data without a Common Field
1. Data Blending
>> Concept
Data blending is a method for combining data from multiple sources. Unlike relationships and joins, blends never truly combine the data, they query each data source independentyly and just simply blend the results from multiple data sources in a visulisation.
In a data blend, one data source is primary and the other is secondary. The primary data source is determined by the field you first add to a view. Data blending brings in additional information from the secondary data source and displays it with data from the primary data source directly in the view.
>> Advantages
- can handle different levels of detail
- able to work with published data sources
- can be established individually on every sheet
2. Blending Your Data
>> Features
- Data blending requires that the data sources share a common dimension.
- Data blending works like a left join. It returns all results from the primary data source, and returns only the matching results from the secondary data source.
- Data blending is Tableau worksheet specific, which means that you can change which data source is primary and which is secondary on different worksheets in the same workbook.
>> Steps for blending data
- Ensure that the workbook has multiple data source
- Drag a field to the view. (The data source this first field comes from will become the primary data source)
- Switch to another data source and make sure there is a blend relationship to the primary data source
- If there is an orange linking field icon (
 ), the data sources are automatically linked.
 - If there are grey, broken link icons (
 ), click the icon next to the field that should link the two data sources.
 - If a link icon does not appear next to the desired field, you need to define blend relationships for blending.
- If there is an orange linking field icon (
- Drag a field into the view from the secondary data source
3. Left Join VS Blending
>> Difference between joins and data blending
The main difference between left join and blending is when the aggregation is performed
-
A join combines the data and then aggregates.
-
A blend aggregates and then combines the data
>> Left join
When using left join to combine data, a query is sent to the database where the join is performed.
Order:
-
A left join returns all rows from the left table and any corresponding rows from the right table
-
then the results of the join are sent back to Tableau and aggregated for display in the visulisation
[Left join] For each row of the left table, check the right table’s rows one by one that whether corresponding information exsists:
- If YES: that data is returned and combined to the left table
- If NO: returns a null
[Example] : common colomns --> User ID & Patron ID
A --left join-- B:
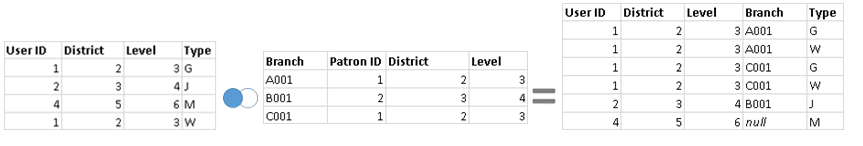
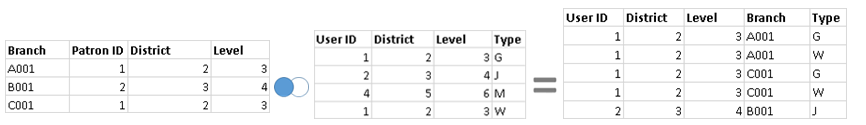
B --left join-- A:
>> Data blending
When using data blending to combine data, a query is sent to the database for each data source that is used on the sheet.
Order:
- The results of the queries are sent back to Tableau as aggregated data
- and then presented together in the visualisation
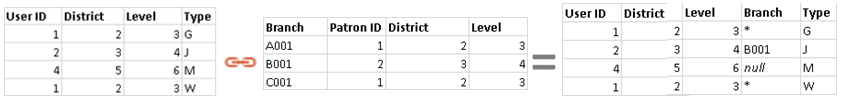
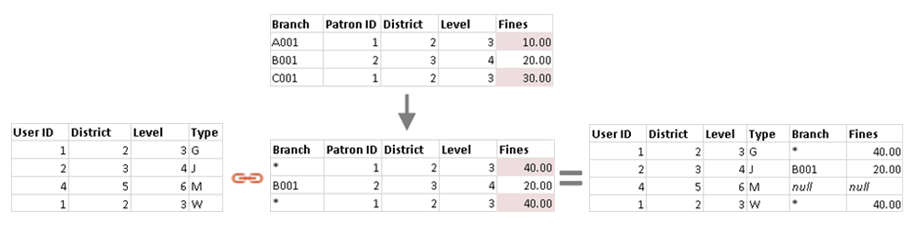
[Data blending] For each row of the left table, check the right table’s rows one by one that whether corresponding information exsists:
If YES: that data is returned. However, different from the left join,
if there is only one row match the left table row in the right, it returns that value
if there are several rows match the same left table row in the right, it returns an aggregate value
- for dimensions: returns an asterisk(*) that indicates multiple values
- for measures: return the aggregation (default: sum)
If NO: returns a null
[Example] : common colomns --> User ID & Patron ID
dimensions aggregation:
measures aggregation:
4. Blending Data without a Common Field
If the data sources have a shared dimension with the same name, Tableau can automatically link them.
However, if they do have the common member but with different names, we can manually link them in three ways:
-
Create a custom relationship
-
Rename one of them to match the other
-
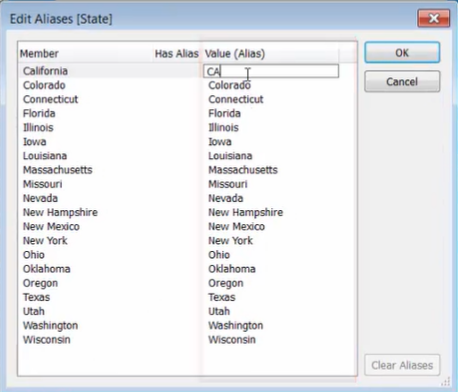
[If the values are different too (e.g. use full names in one and abbreviations in another)]:
Edit aliases of the values in a data source to make them match the other data source
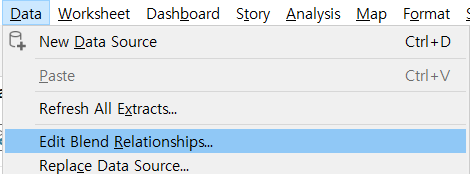
1. Create a custom relationship:
-
[Data] menu --> [Edit Blend Relationship]
-
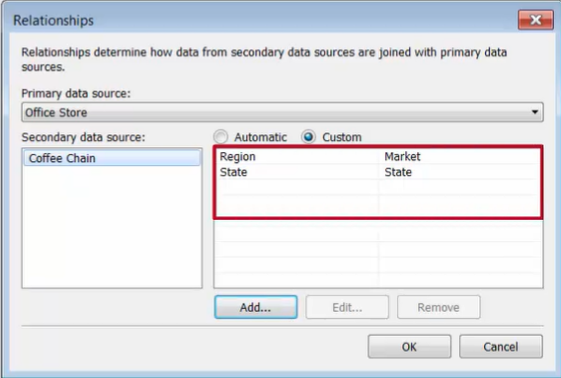
In the [Relationship] dialog box:
-
select the primary and secondary data source
-
choose [Custom]
-
Add mapping fields
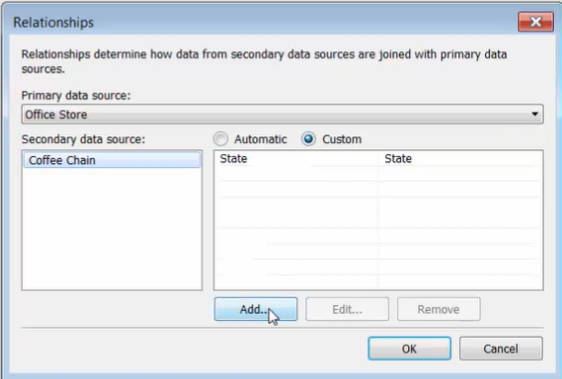
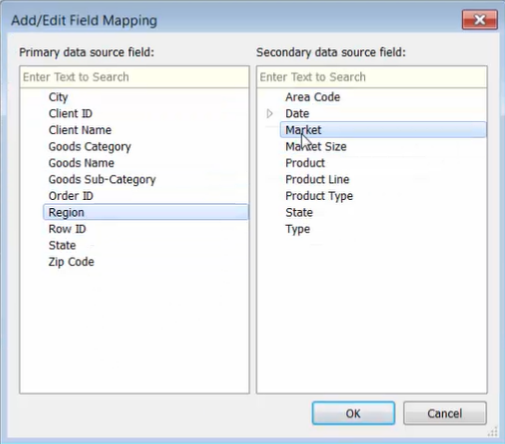
-
-
The relationship appears, along with the automatic relationship Tableau found on State
2. Rename the common member:
-
[Data] Pane --> common member field --> right-click --> [Rename]
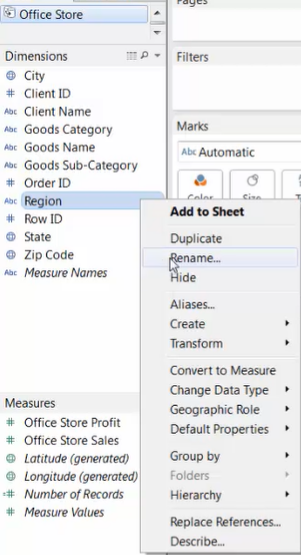
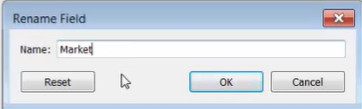
-
Tableau will now recognize the link between them
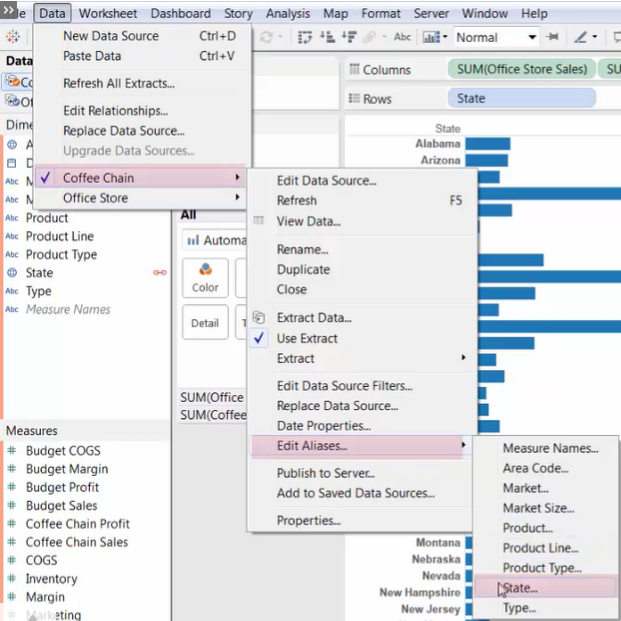
3. Edit aliases:
- [Data] Menu --> select data source --> [Edit Aliases] --> choose the common member field