Organize Data and Create Filters
- 1. Creating Groups in Your Data
- 2. Creating Hierarchies (계층) in Your Data
- 3. Understanding Filtering in Tableau
- 4. Filtering Your Data
- 5. Sorting Your Data
1. Creating Groups in Your Data
>> Groups in Tableau
Groups in Tableau are represented by a paper clip: 
- In the [Data] Pane: displayed to the left of the field
- In the [tooltip]: represents the Group Members button that is used to create a group.
>> Methods to create groups
- Create a group based on a field in the Data pane.
- Create a group based on labels in the view.
- Create a group based on marks in the view.
>> Details for each method
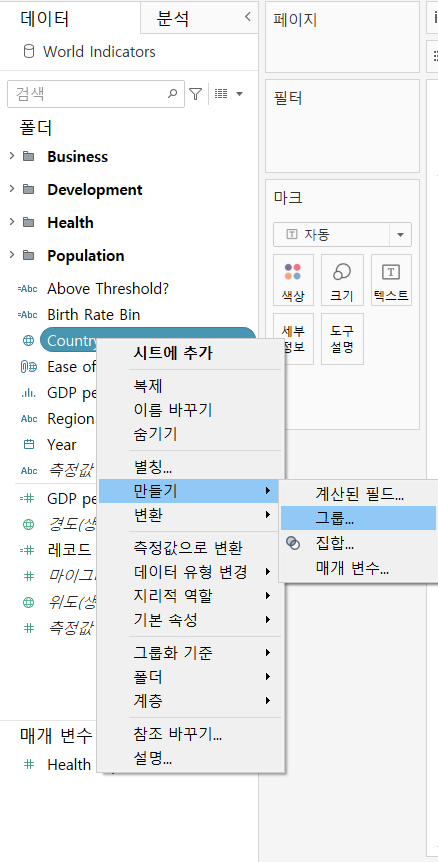
Method 1. Creating a group from the Data pane
-
Create a group
- Field --> right-click / click the arrow --> [Create] > [Group]
-
Adding members
-
Select relative terms directly
-
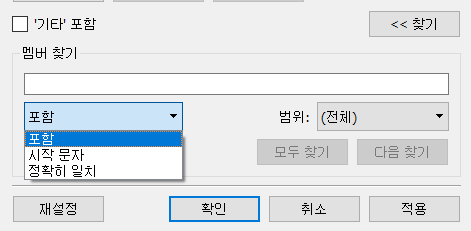
Use [Find]to find terms with specific pattern
-
Dragging fields into the existing group
-
-
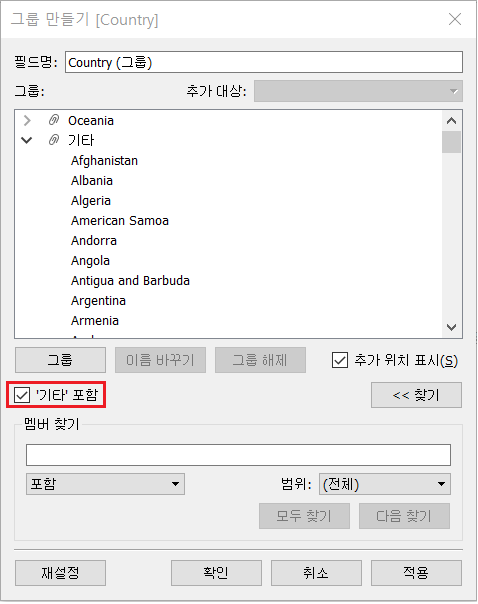
Group remaining members as the group [Other]
- check [Include ‘Other’]
-
Editing a group
- Rename the group
[[실습]]
Create a Group in the Data pane with World Indicators.twbx
<Scenario>
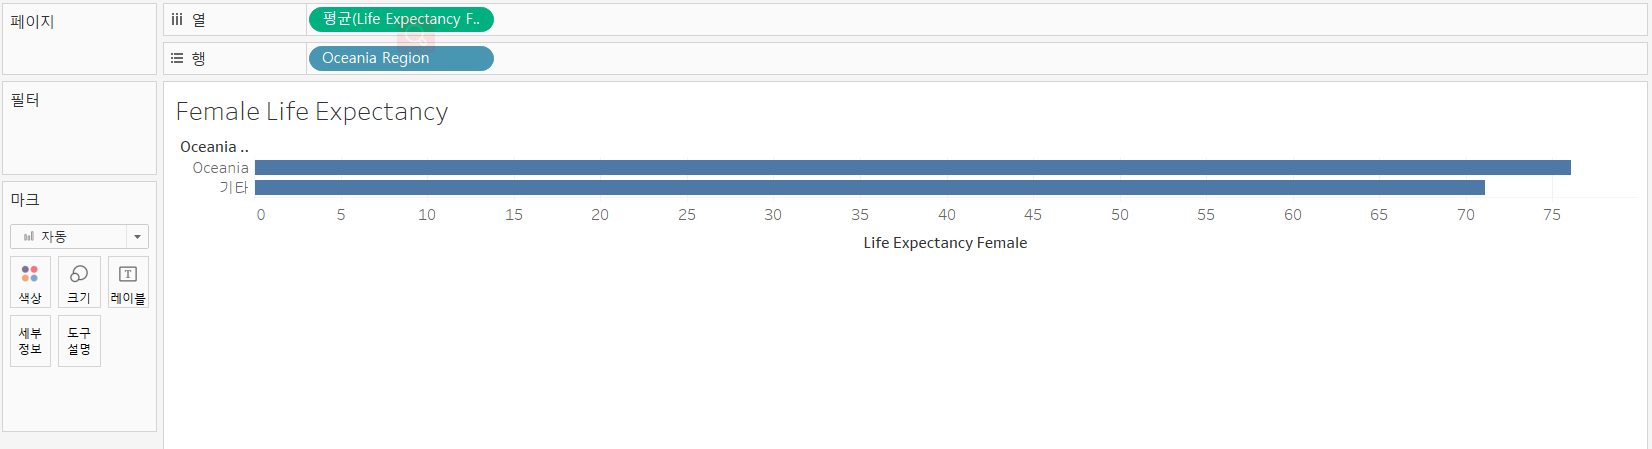
You want to find out average life expectancy for three countries within the Oceania region, and then compare that with other regions.
You will create a group named Oceania for the three countries, Australia, New Zealand, and Papua New Guinea, and compare the group with the rest of the countries.
<실현>
-
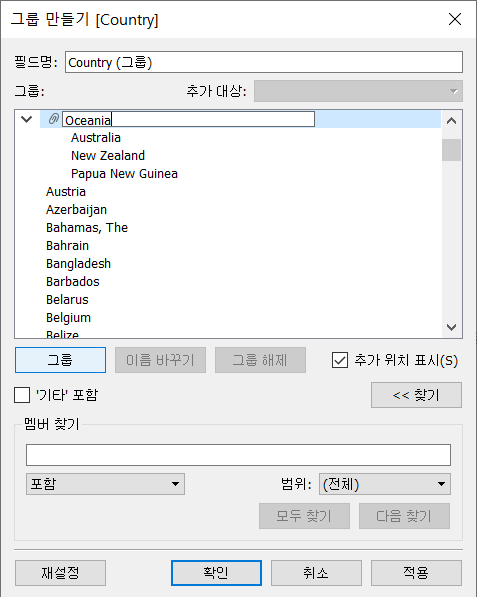
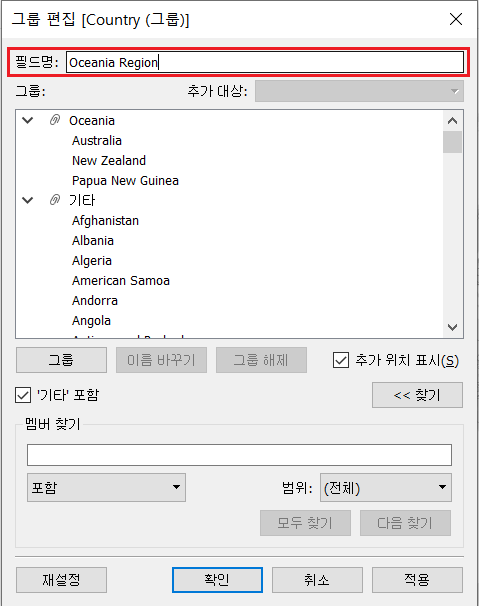
Create a group on [Country] that includes [Australia], [New Zealand], and [Papua New Guinea], and name it [Oceania]
- [Country] --> [Create] --> [Group]
- Ctrl + select [Australia], [New Zealand], and [Papua New Guinea] and click [Group]
- Rename the alias [Oceania]
-
Group all other countries together as [Other]
- Check the [Include “Other”] checkbox
-
Name the group field
-
Compare the [AVG(Life Expectancy Female)] of Oceania group with others
Method 2. Creating a group from within the view
-
Creating a group by selecting marks from within the view
- Click and drag to select the marks
- In the tooltip opens, click the paper clip
- choose the dimensions to be applied
-
Creating a group using labels in the view
- Hold [Ctrl] to select the marks in the view
- Use the dropdown or right-click one of the selected fields, then select the Group (paper clip) icon
- choose the dimensions to be applied
[[실습]]
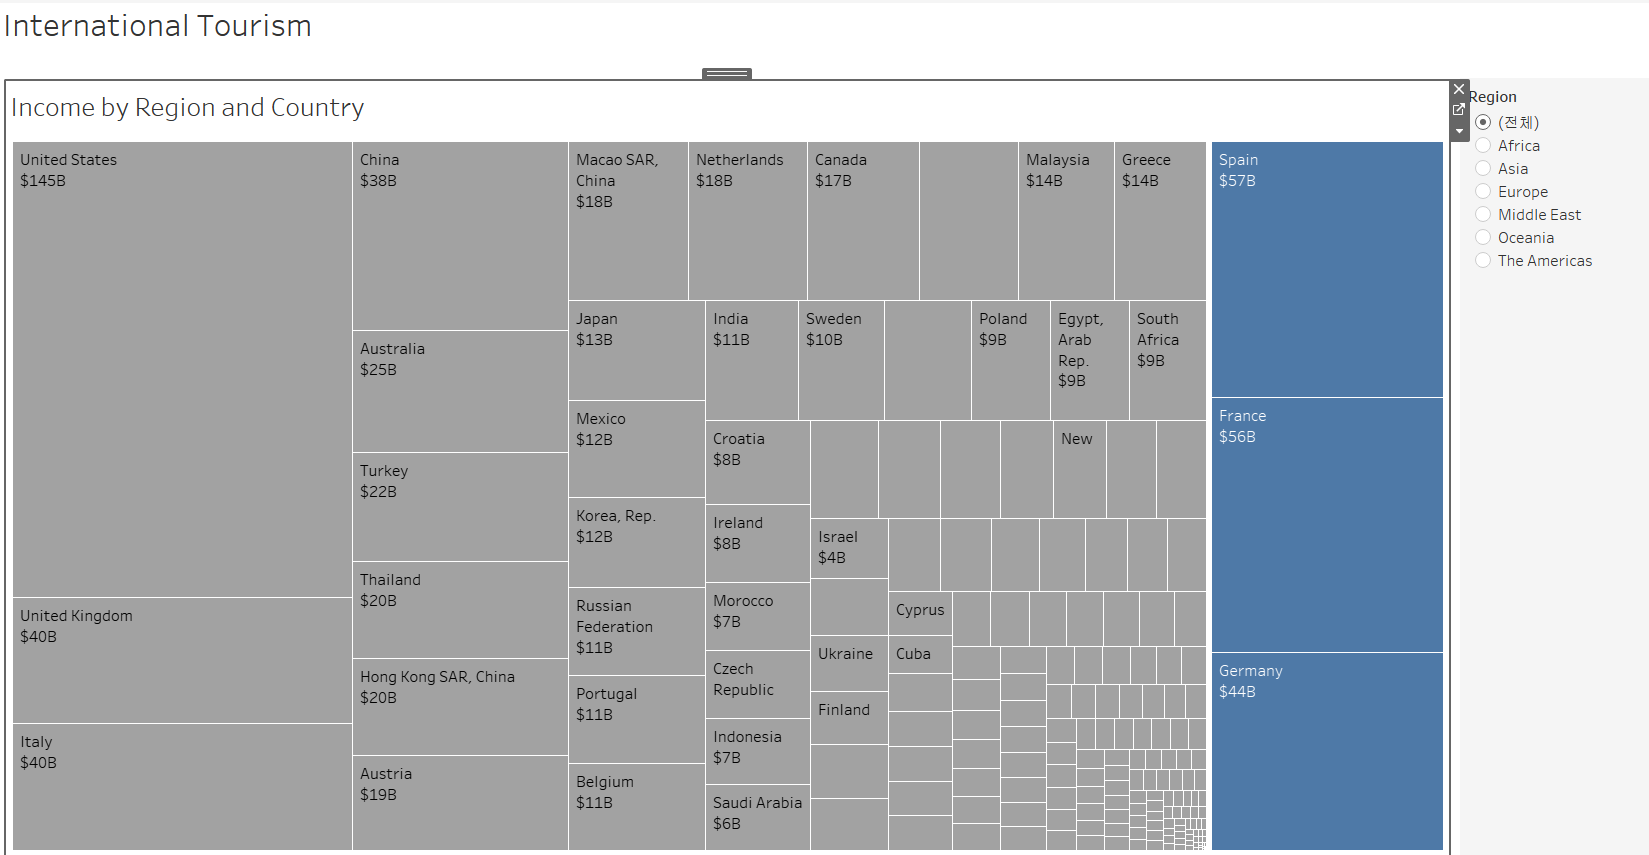
Create a Group in the View with World Indicators.twbx
<Scenario>
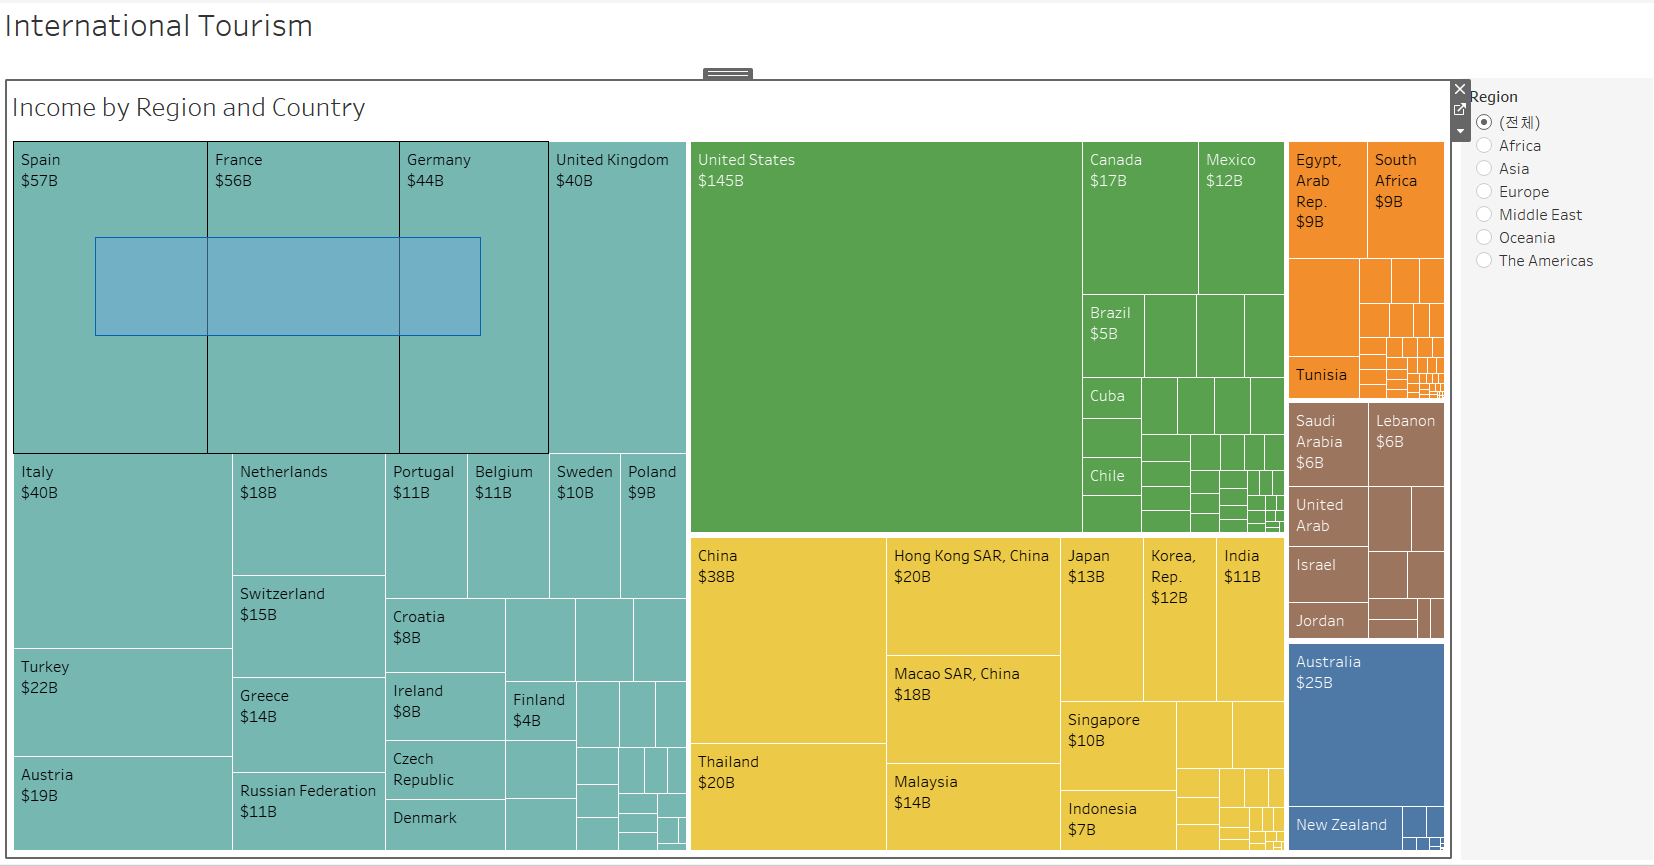
You want to quickly compare the income of two separate country groups to determine if tourism is similar based on the size in a treemap.
You will create a group from Spain, France, and Germany to compare to tourism in the United States within the view.
<실현>
-
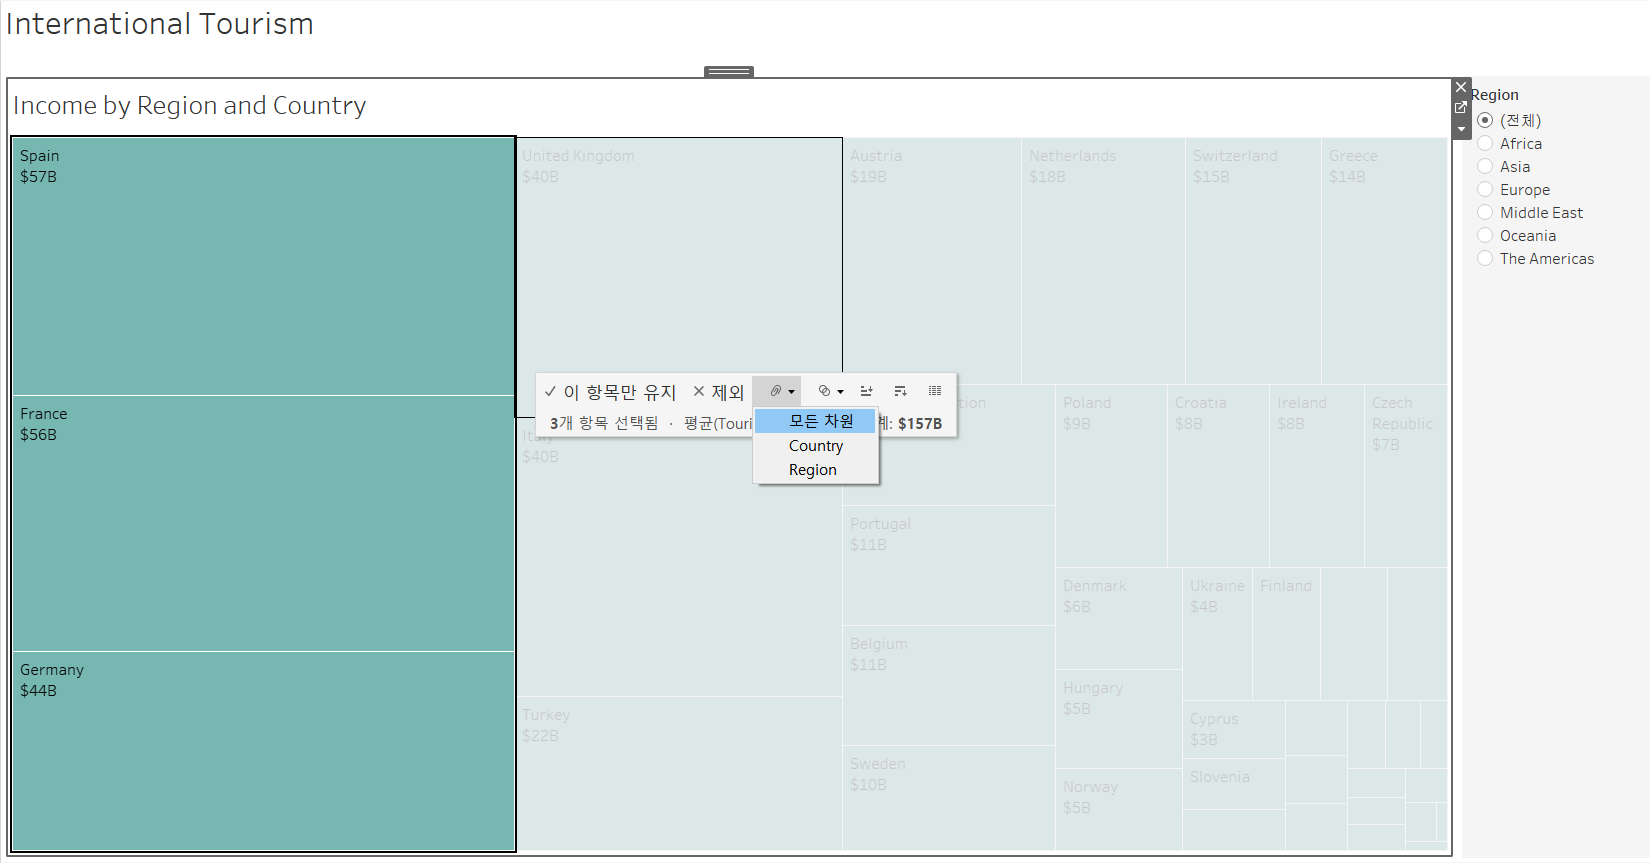
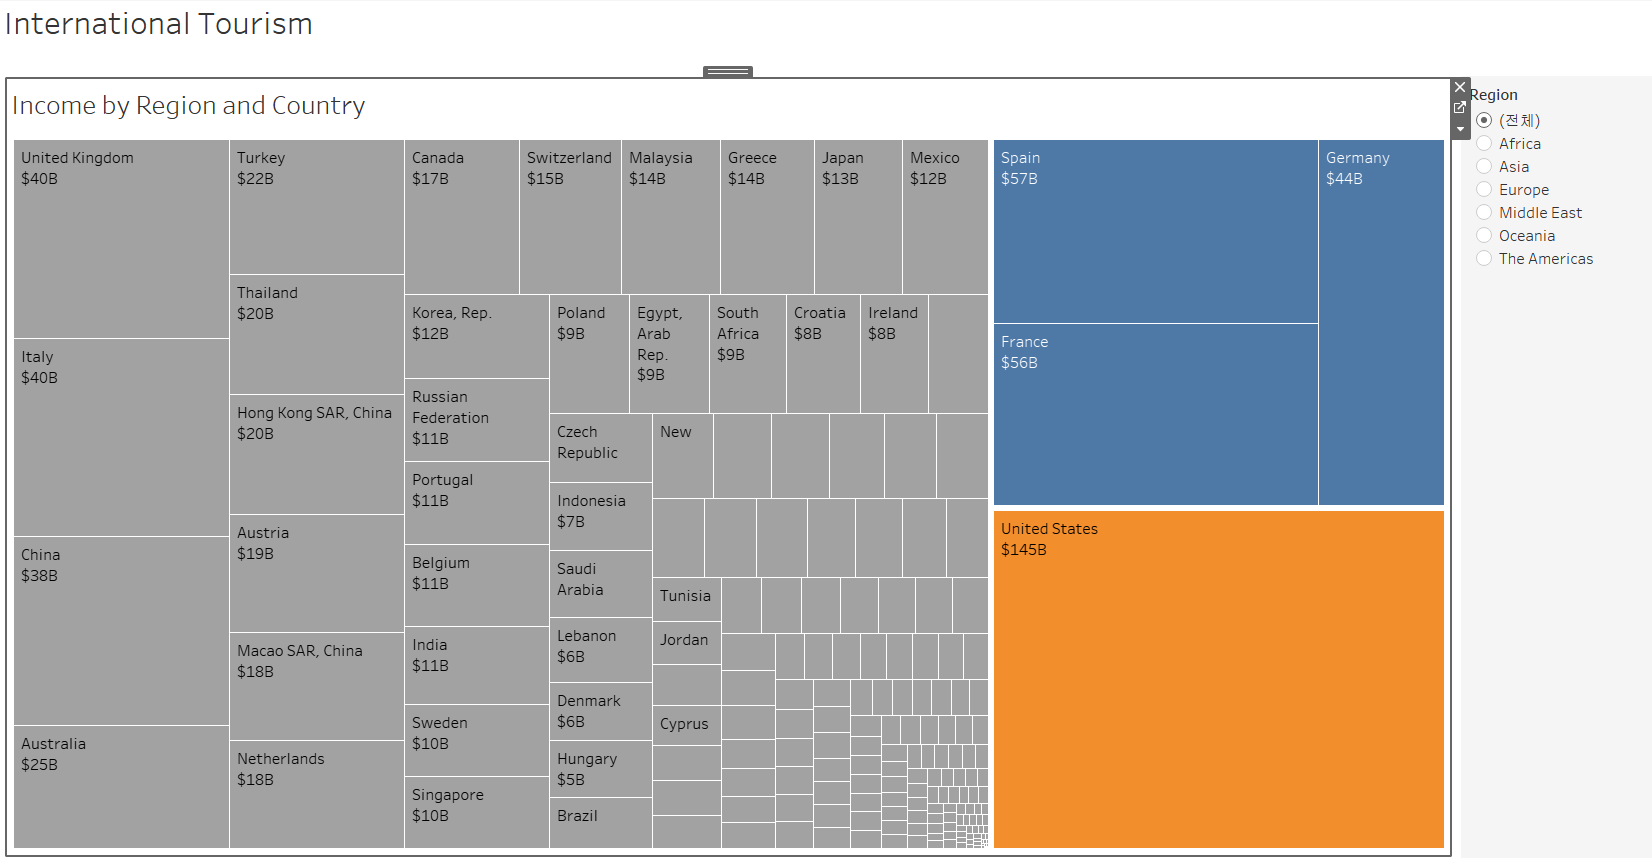
Create a group in the treemap that contains [Spain], [France], and [Germany]. Group on [All Dimensions].
-
drag to select [Spain], [France], and [Germany]
-
In the dialog opened, click the paper clip, then select [All Dimensions]
-
-
Create a second group from a single mark: [United States]
- Click [United States] to select it
- In the dialog that opens, click the paper clip
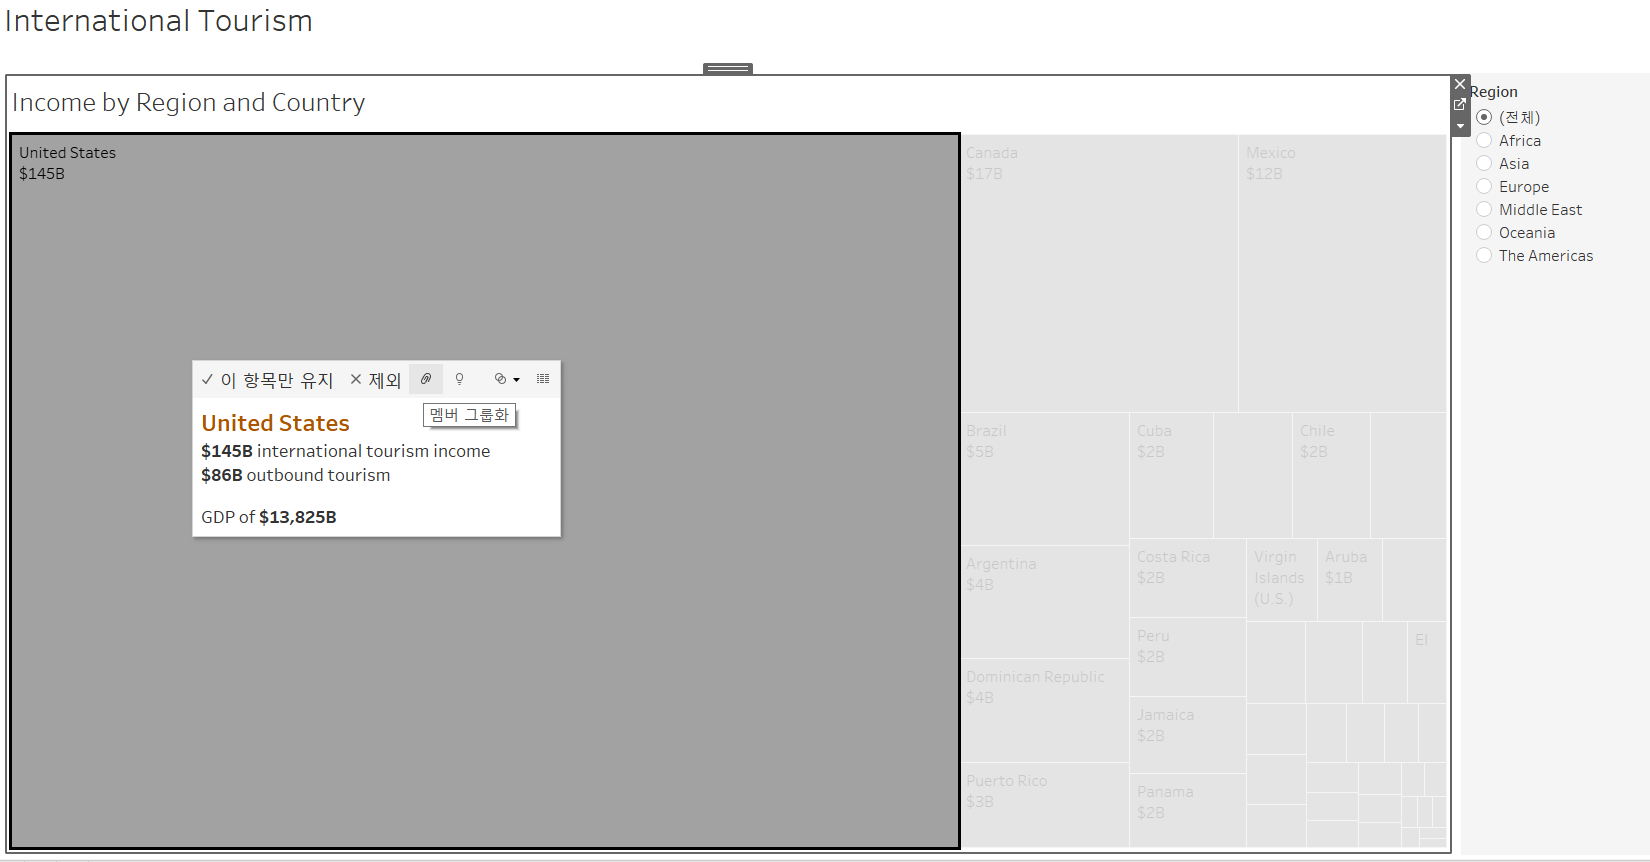
-
Compare the size of each group
- The two groups are roughly the same size
2. Creating Hierarchies (계층) in Your Data
>> Hierarchies in Tableau
- In Tableau, a hierarchy is an arrangement of data fields in a hierarchical format with an ‘above’ and ‘below’ structure.
- Hierarchies are represented by a hierarchy icon:
>> Date hierarchies
- dates and times are automatically placed in the dimensions area of the [Data] pane and are identified by the date
 or date-time
  icon, and can be drilled up and down as a hierarchy.
 - Date fields can consist of the following:
- Year
- Quarter
- Month
- Day
- Time
>> Methods to create hierarchies
3 Steps:
-
Method 1: Field --> right-click --> Hierarchy (계층) --> Create Hierarchy (계층 만들기)
Method 2: In the [Data] Pane, drag one field onto the other field
-
dialog box opened --> name the hierarchy
-
drag other fields into the existing hierarchy
3. Understanding Filtering in Tableau
>> Filter types in Tableau
-
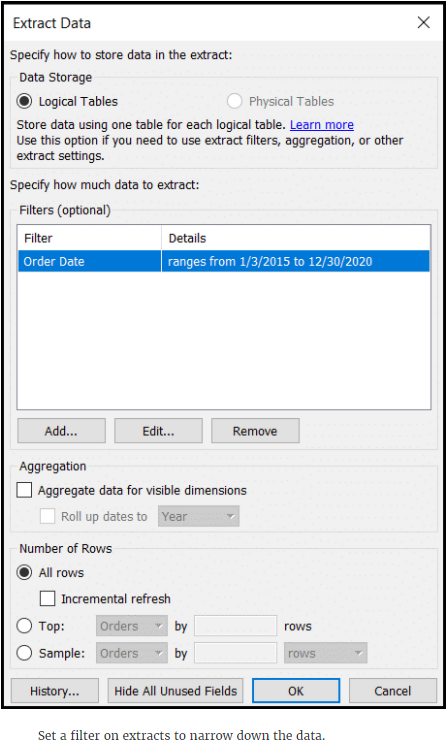
Extract Filters
- When you connect to data, you can choose to extract it. As part of this process, you can filter out data that isn’t relevant to your analysis.
[e.g.] you are querying a data source that has data for the last 20 years, but you only want last 5 years of data.
-
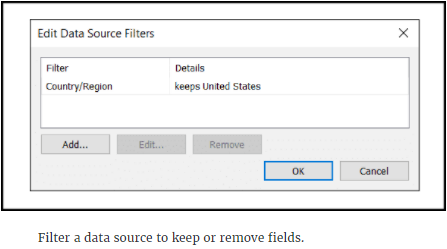
Data Source Filters
- Reduce the amount of data being fed into Tableau
- Restrict what data the viewer sees (like filtering sensitive data out)
[e.g.] Filter the data of United States
-
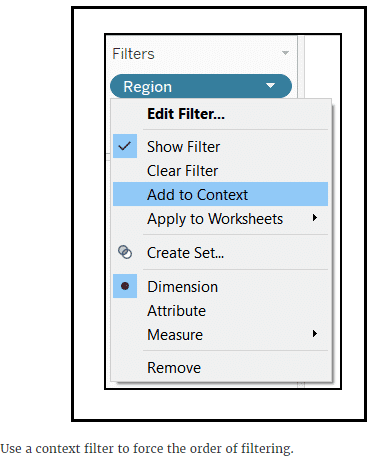
Context Filters
- All filters in Tableau are computed independently. If you want one filter to be applied before other filters, make it a context filter so it will be processed first.
[e.g.] you have two dimension filters, one on Region and another top 10 on products, both filters will apply to the entire data set. If you want to see the top 10 products in each region, set the Region filter as the context filter.
-
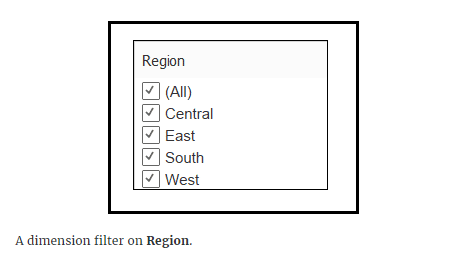
Dimension Filters
- Dimensions contain discrete categorical data, so filtering this type of field generally involves selecting the values to include or exclude.
[e.g.] Show products that have low sales in specific regions.
-
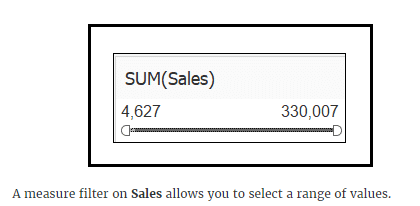
Measure Filters
- Measures contain quantitative data, so filtering this type of field generally involves selecting a range of values that you want to include.
[e.g.] Show only products that have sales greater than 10,000.
-
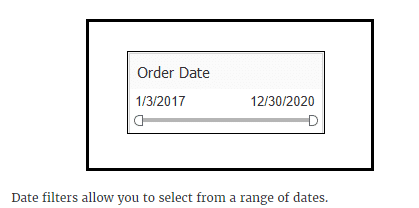
Date Filters
- Date filters allow you to filter data by a range of dates, relative dates, or exact dates.
[e.g.] Show products that have been ordered starting January 2017.
-
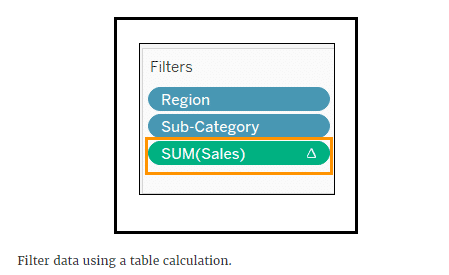
Table Calculation Filters
- If you want to filter the view without filtering the underlying data, Table Calculations filters are the way to go.
[e.g.] Filter data using a table calculation
>> Filtering order of operations
When you use multiple filters on your data, the filters get applied in a very specific order, called the order of operations.
Tableau executes filters in the following order:
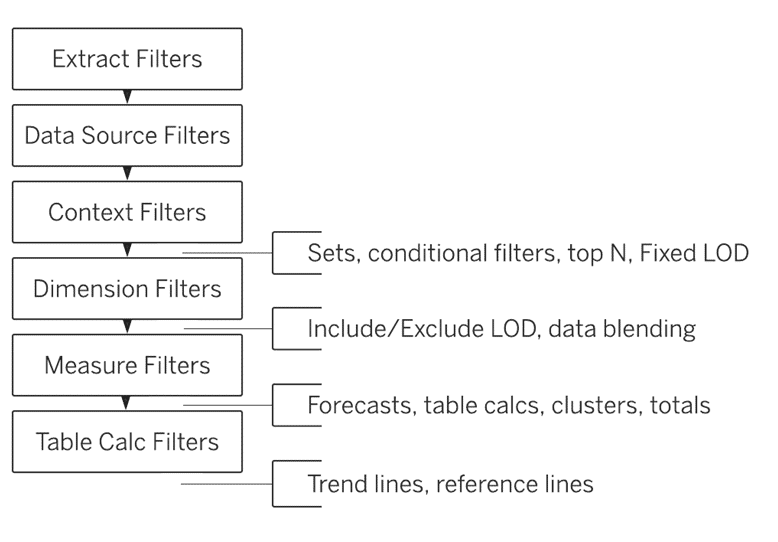
4. Filtering Your Data
>> Filtering on Dimensions
Methods to create a dimension filter
-
Filter by including or excluding data points
-
Drag to select data points in the view
-
On the tooltip that appears,
select [Keep Only] to include the selected marks
select [Exclude] to exclude the selected marks
-
Tableau add the filter to the Filters shelf automatically
-
-
Filter by dragging dimensions to the Filters shelf
- Drag the dimension field from the [Data] pane to the [Filters] shelf
>> Filtering on Measures
Method to create a measure filter
- Drag a measure to the [Filters] shelf --> [Filter Field] dialog box appears
- Select an aggregation
- Select a filter type
- Range of Values
- At Least
- At Most
- Special: Filter on Null values
>> Filtering on Dates
Method to create a date filter
- Drag a date field to the [Filters] shelf --> [Filter Field] dialog box appears
- Select to filter by [Discrete date parts] or [Continuous date values]
- Discrete date parts: years, quarters, months etc.
- Continuous date values:
- Relative dates (相对日期) [可以设置“基准日期”(Anchor):默认为“today” ]
- Range of dates
- Starting date
- Ending date
- Special: filter on Null value
5. Sorting Your Data
>> Two sorting methods:
- Computed sorts
- organize the data by applying rules
- update dynamically
- manual sorts
- a specific order that you want your data to be in
- maintain the order that you put things in
>> Customizing the sort using the Sort menu
-
정렬 기준 (Sort By):
- Data source order
- Alphabetic
- Field (비중첩)
- Manual
- Nested (중첩)
-
정렬 수단 (Sort from):
- axis (축) — 중첩
- header (머리글)
- field label (필드 레이블) — 비중첩
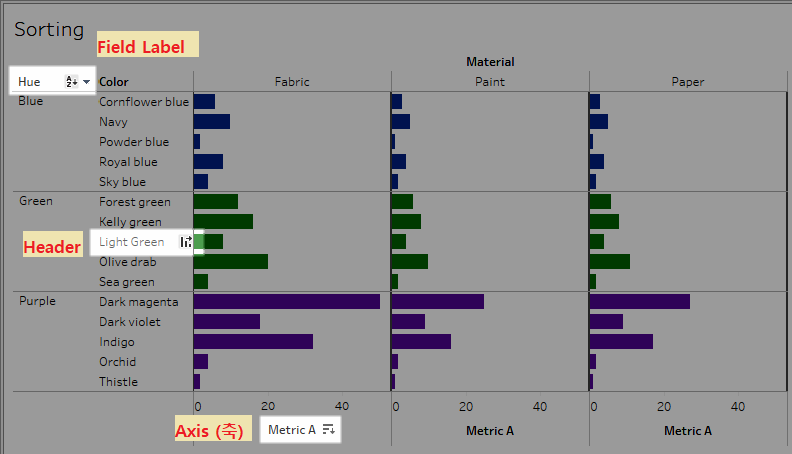
모든 경우에:
- 1 click: sorts descending [한 번 클릭: 내림차순]
- 2 clicks: sorts ascending [두 번 클릭: 오름차순]
- 3 clicks: clear the sort [세 번 클릭: 정렬 해제]
-
중첩 (Nested) VS 비중첩
중첩 비중첩 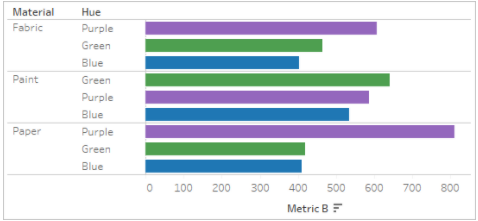
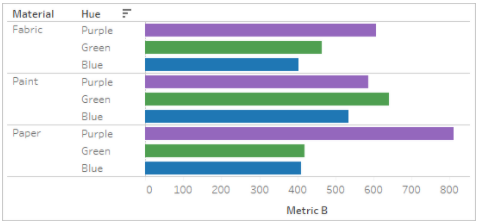
* 각 Pane을 독립적으로 고려함
* Pane별로 행을 정렬* 전체 Table 기준으로 집계 후 차원값을 정렬
* 모든 Pane에서 같은 값 순서를 적용Sort by Nested;
Sort form AxisSort by Field;
Sort form Field Label
-
Disable the sort
Menu bar --> [Worksheet] --> uncheck [Show Sort Controls]