Table Calculations
1. Including Helper Functions in Table Calculations
>> Helper Functions
You might need to write a custom table calculation when you want your calculation to reference another row or column of the table. To direct Tableau to the correct values, we can make use of Helper functions.
Helper functions are special table calculations that can be used to point to a location of specific values in the data table. They’re often combined with other expressions or functions to build more powerful calculations.
>> Four Helper Functions
-
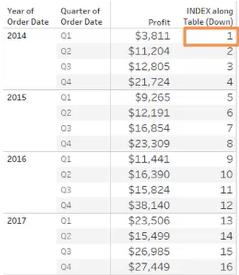
INDEX(): Shows the current row of the partition
Scope: Table -->
 Scope: Pane –
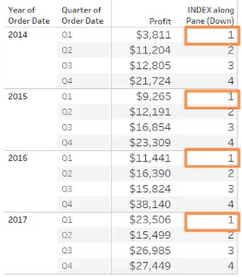
-
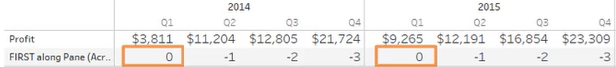
FIRST(): Reports how far each cell is from the first cell in the partition [ INDEX(FIRST) - INDEX(now) ]
Scope: Table -->
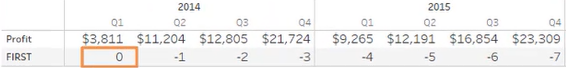
Scope: Pane -->
-
LAST(): Reports how far each cell is from the last cell in the partition [ INDEX(LAST) - INDEX(now) ]
Scope: Table -->

Scope: Pane -->

-
SIZE(): Returns the number of rows in the current scope
SIZE() returns 12 if the current part of the table shows sales for months in a year
>> Using Helper Functions with Another Function
Helper functions can be used alone or with another function.
When using with other functions (like LOOKUP function), helper functions can be used to direct the expressions to the location of a specific value based on the structure of the table.
[ LOOKUP function + Helper functions ]
-
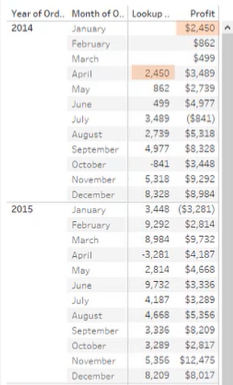
LOOKUP(expression, offset):
Returns the value of the given expression in a target row, specified as a relative offset from the current row.
-
[Example] :
-
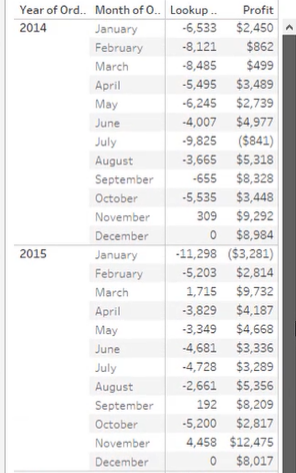
Find the profit value from three rows up the table:
LOOKUP( SUM([Profit]), -3 )
-
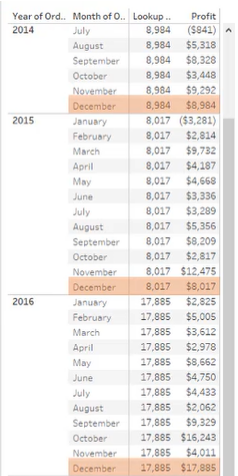
Compare the profit value to the last month of the year:
-
Use LAST() function as the offset of the LOOKUP function to return the value of the SUM of Profit for the last month in the partition)
LOOKUP( SUM([Profit]), LAST() )+ Change the scope to [ Pane (down) ]
-
Calculate how monthly profits compared to the last month of each year
SUM([Profit]) - LOOKUP( SUM([Profit]), LAST() )
-
-
2. Secondary Calculations
Often, we use table calculations to add another layer of meaning to our data.
Especially, with the table calculations Running Total and Moving Calculation, we have the option to add one more layer of meaning to our view — that is, to add a secondary table calculation on top of the primary one.
Since secondary calculations can be displayed with an independent scope and direction from the primary calculation, it’s important to consider how the secondary calculation changes the story your data tells.
[Example]
<< Goal >>
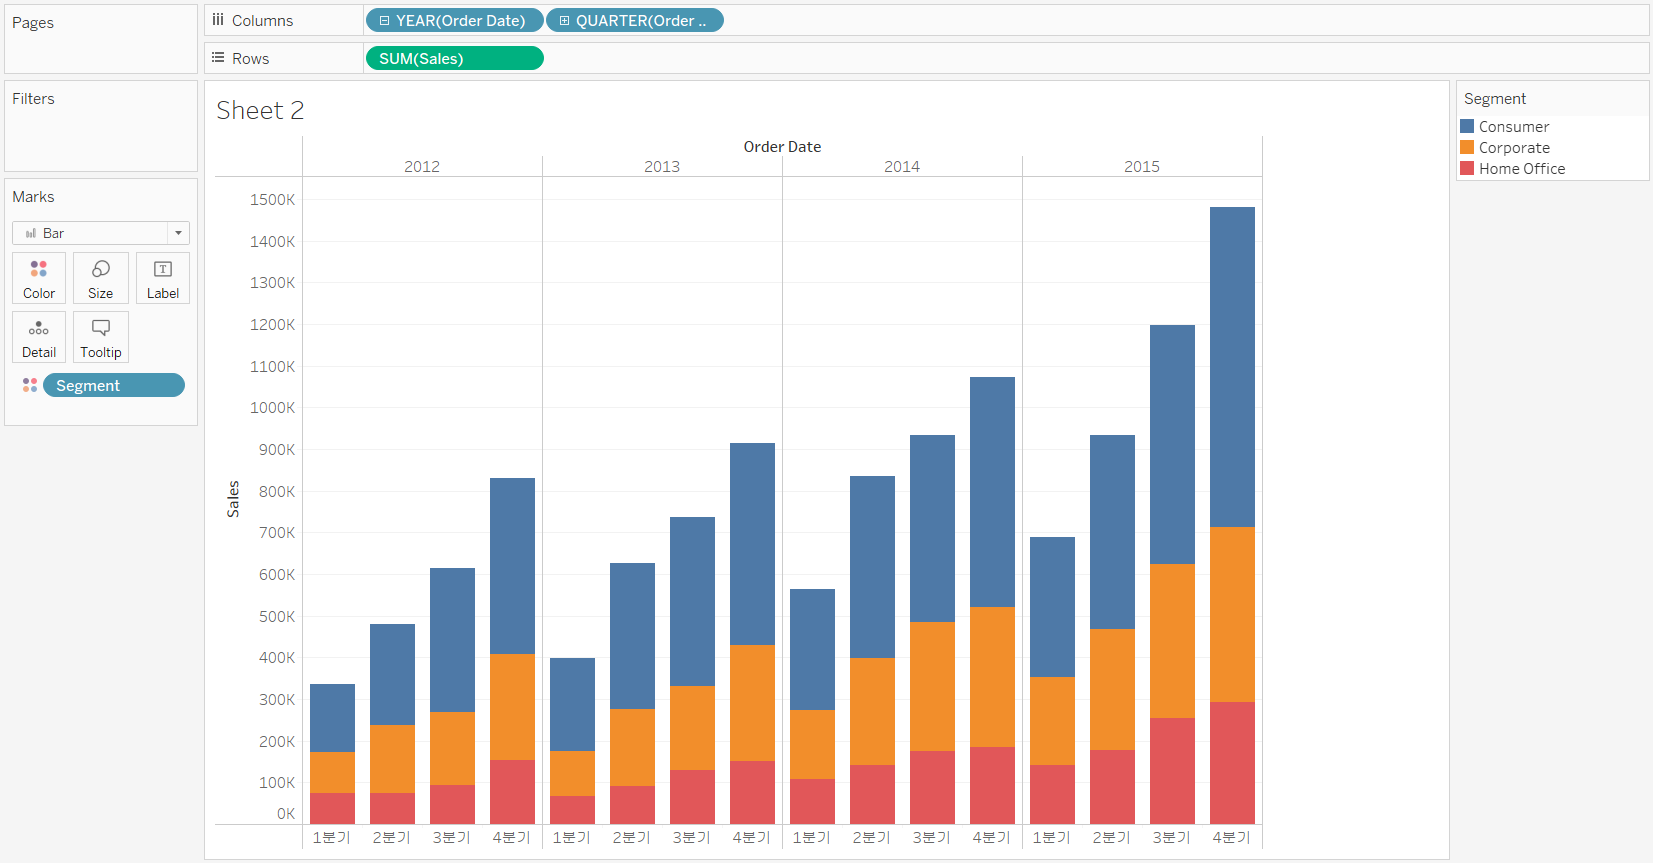
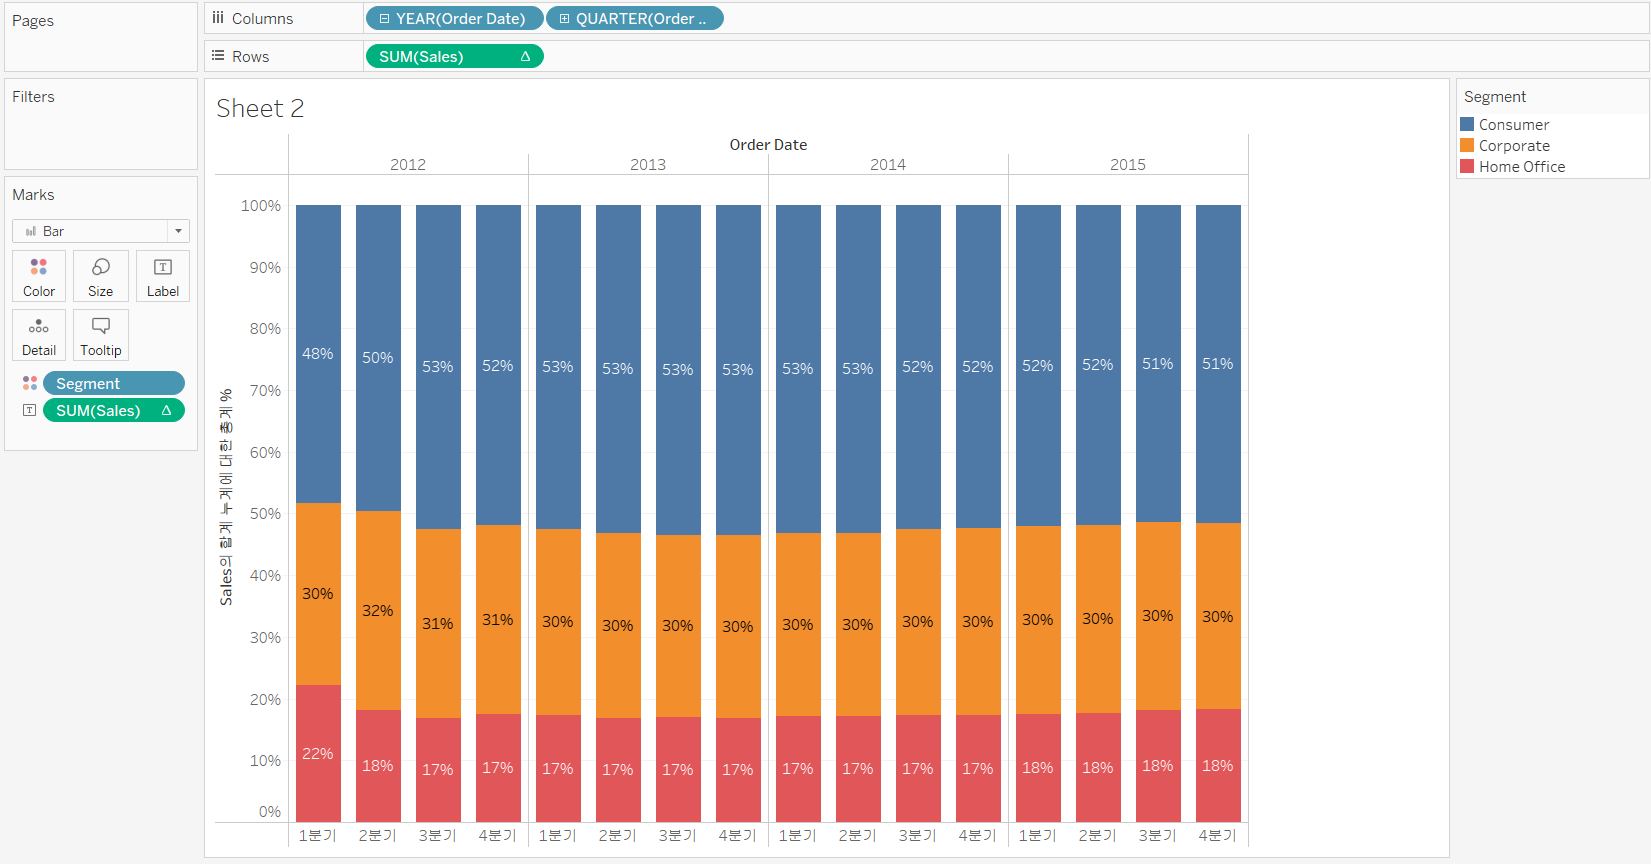
With the Superstore dataset, we wonder the contribution of each segment to the running total of sales for the quarter.
[Step 1] Create the Basic View: sum of sales by quarter for each segment
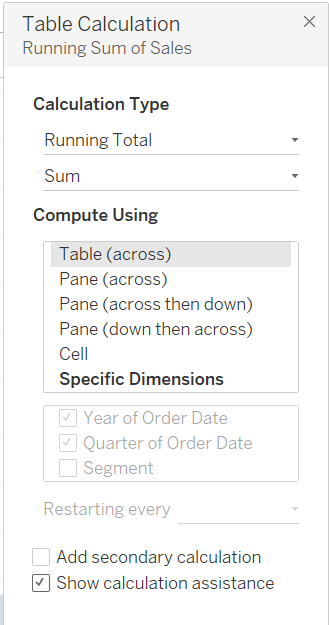
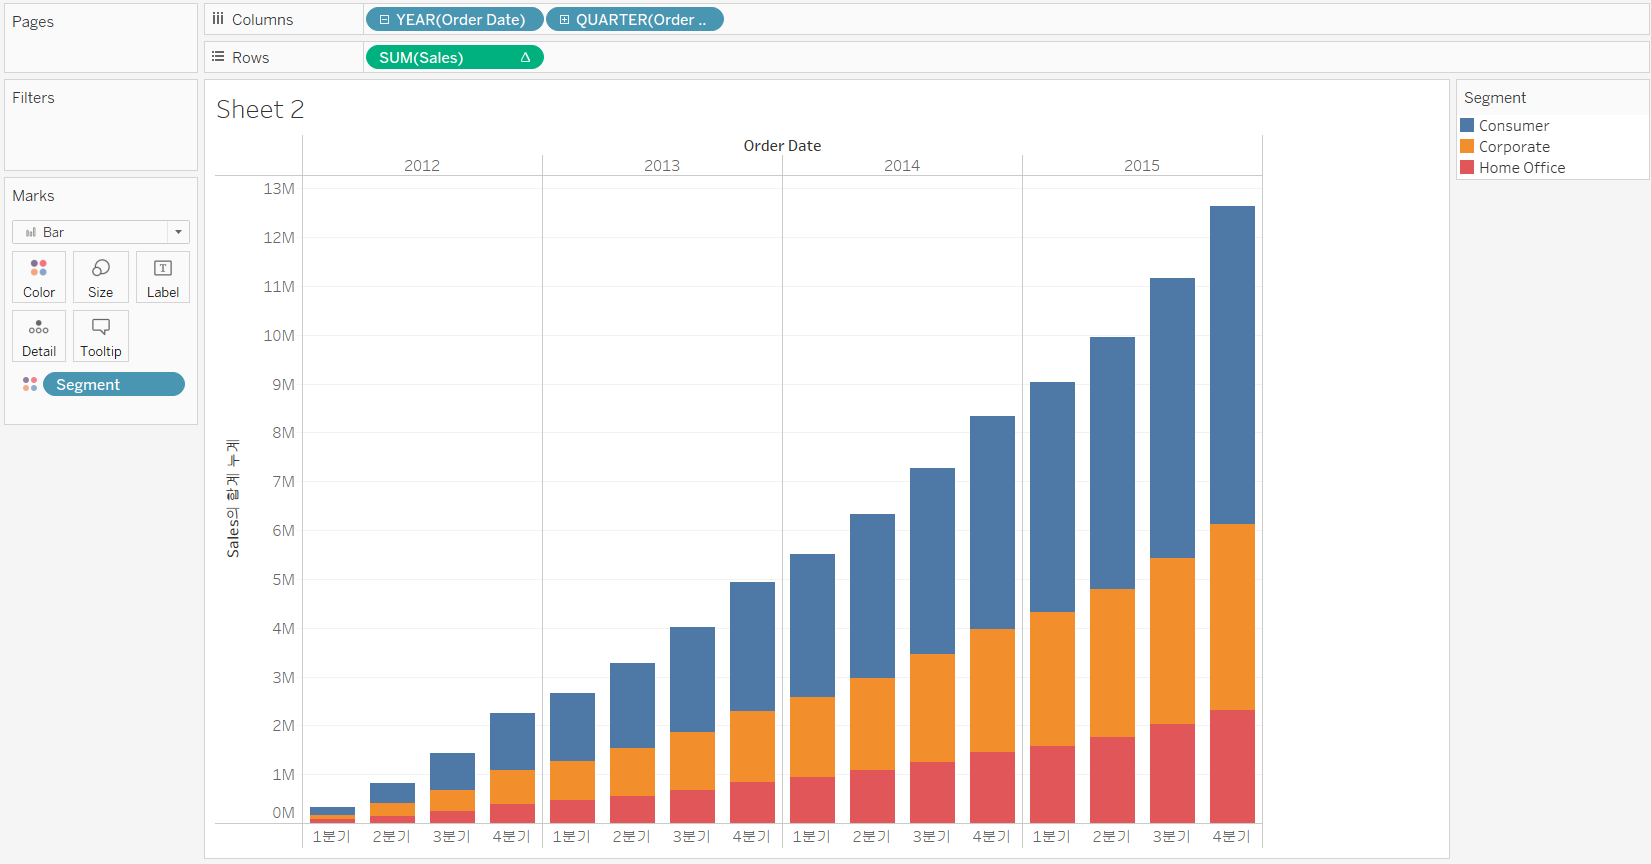
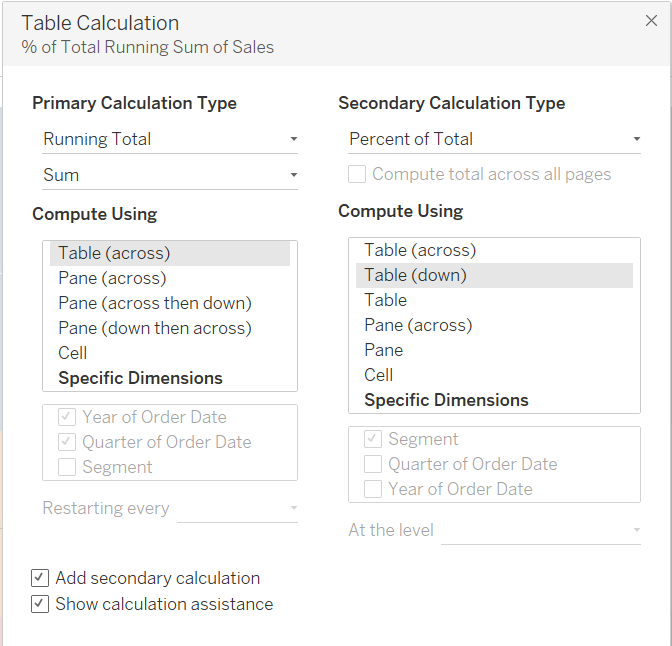
[Step 2] < Primary Table Calculation > Calculate the running total of SUM(sales) for each quarter
[Step 3] < Secondary Table Calculation > Calculate the contribution of each segment to the running total
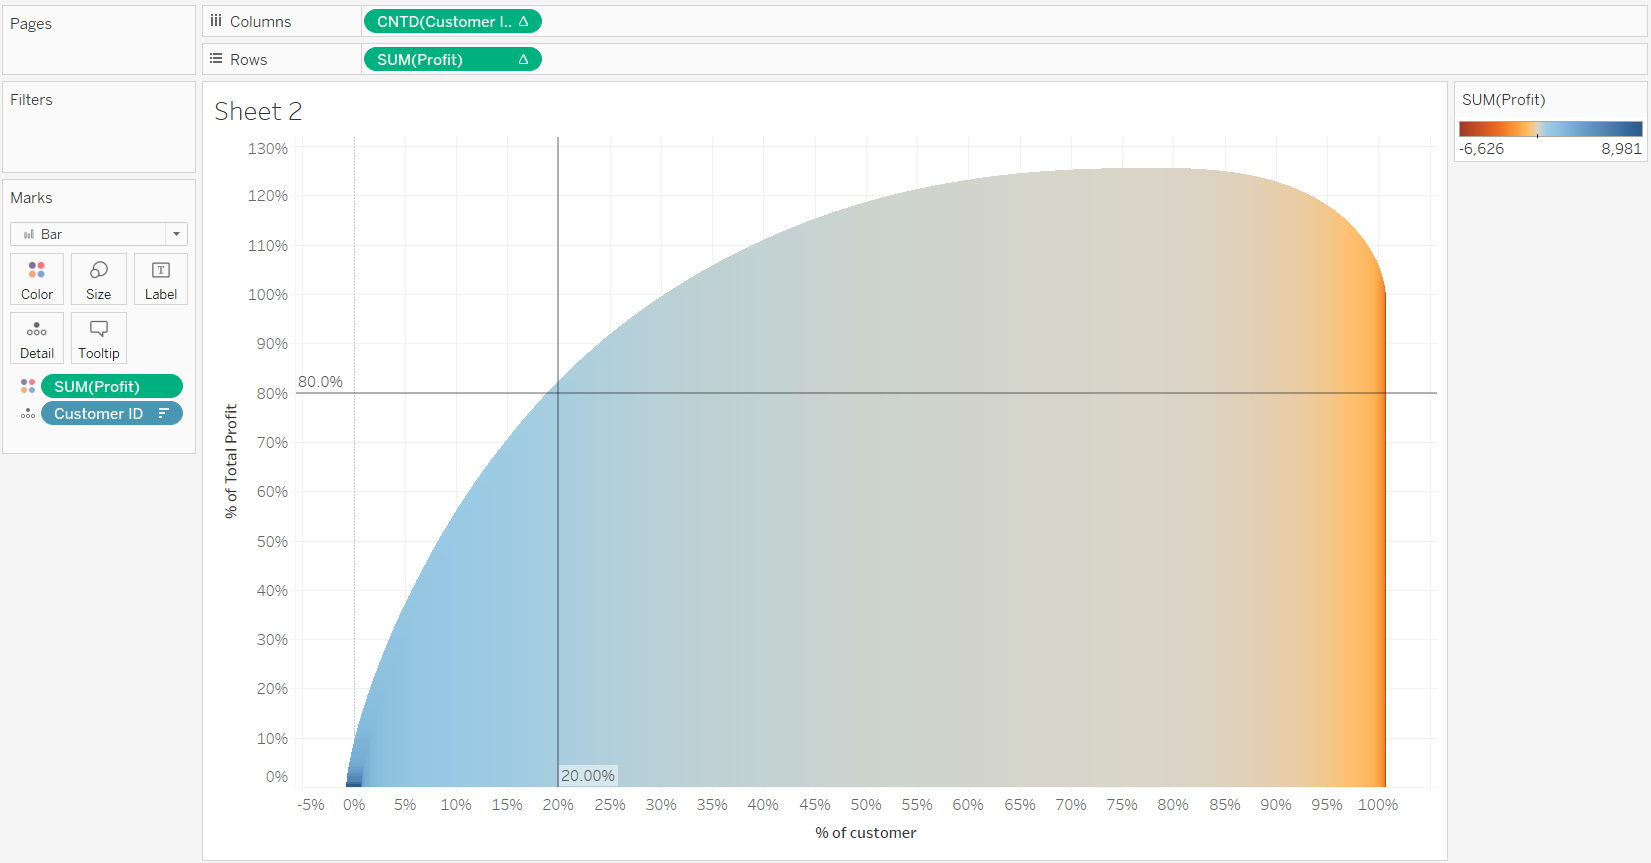
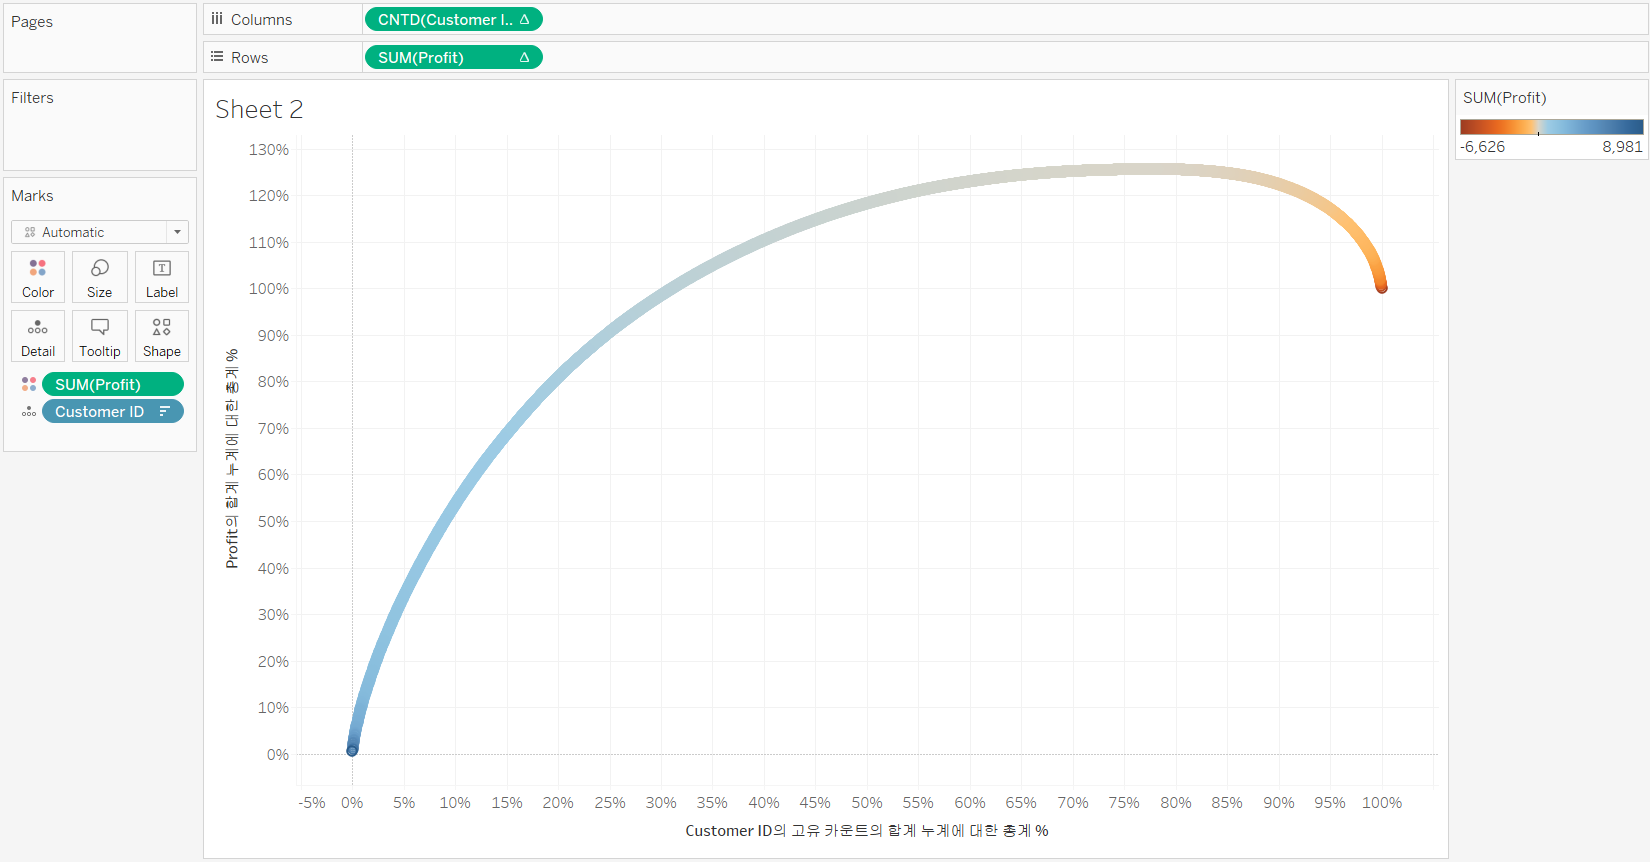
3. Pareto Charts
The Pareto Chart was designed to help highlight the Pareto principle, which is sometimes called the Law of the Vital Few or the 80/20 rule. The Pareto principle states that in many cases, the majority of the results will come from a vital few of the causes.
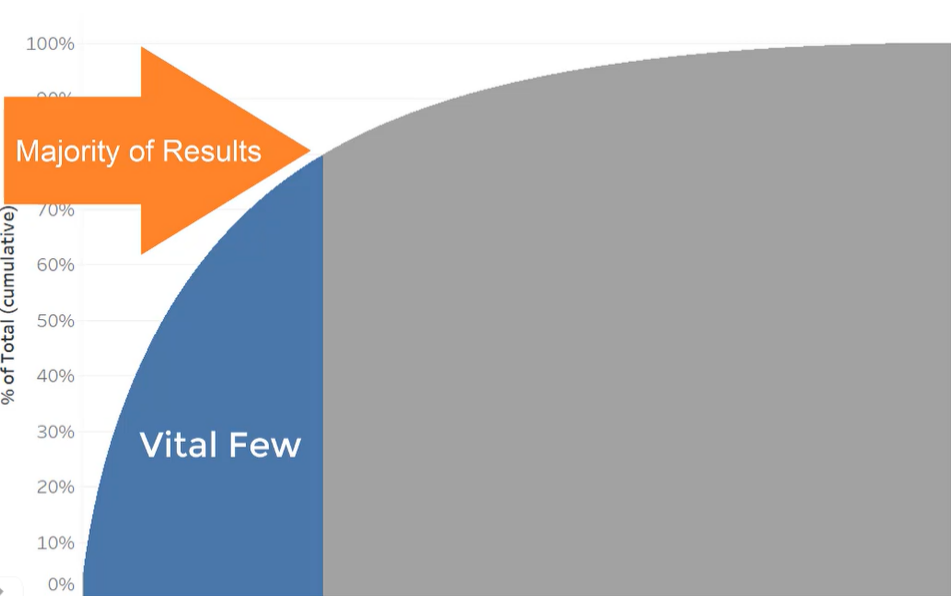
A Pareto chart can help highlight the uneven distribution of contributions to your KPIs, so you can focus your efforts for the greatest impact.
[Example]
<< Goal >>
Build a Pareto chart to show how customers contribute to profitability, including how much is lost to unprofitable customers.
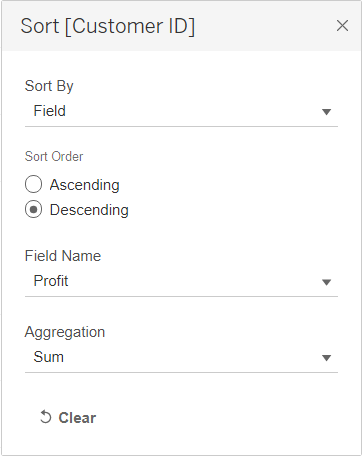
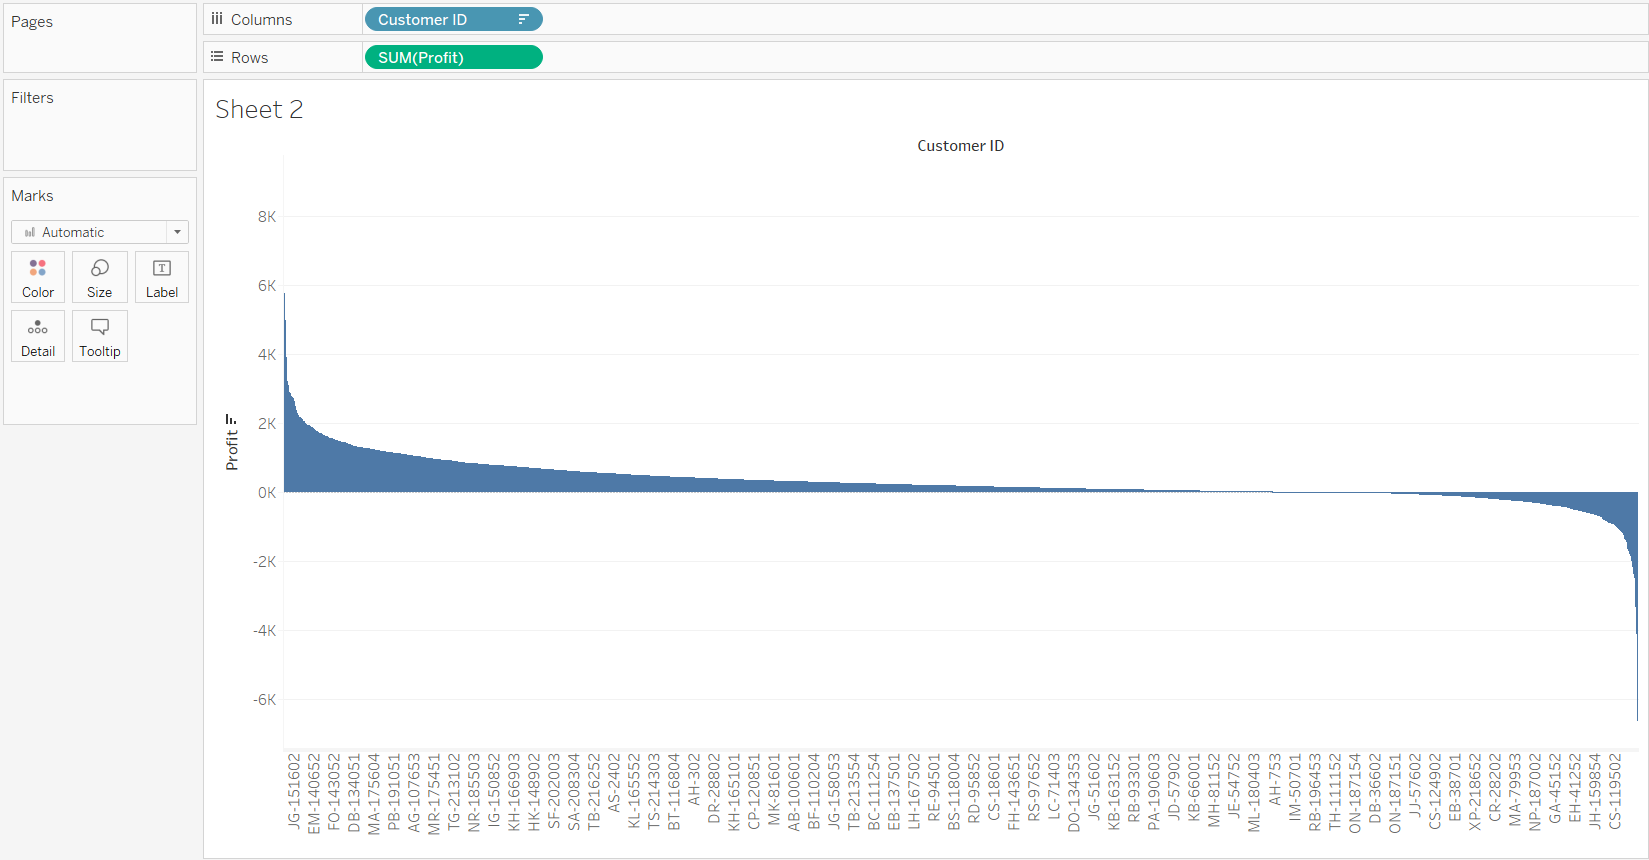
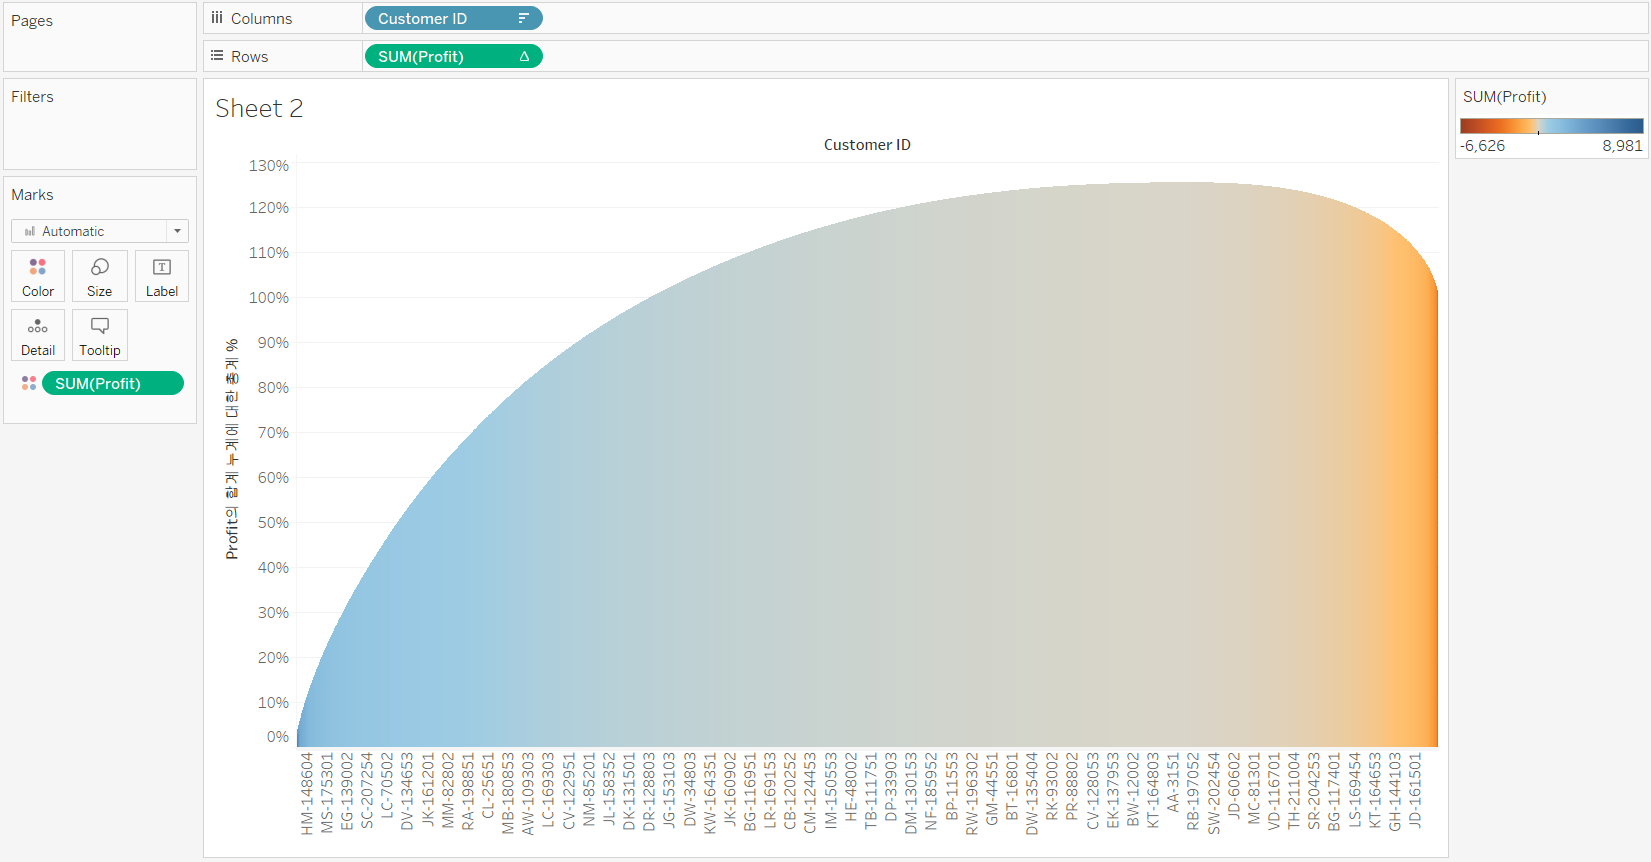
[Step 1] Create a sorted bar chart to show the profit by customer
-
Sort Customer ID by Descending Profit
-
Fit it to the Entire View
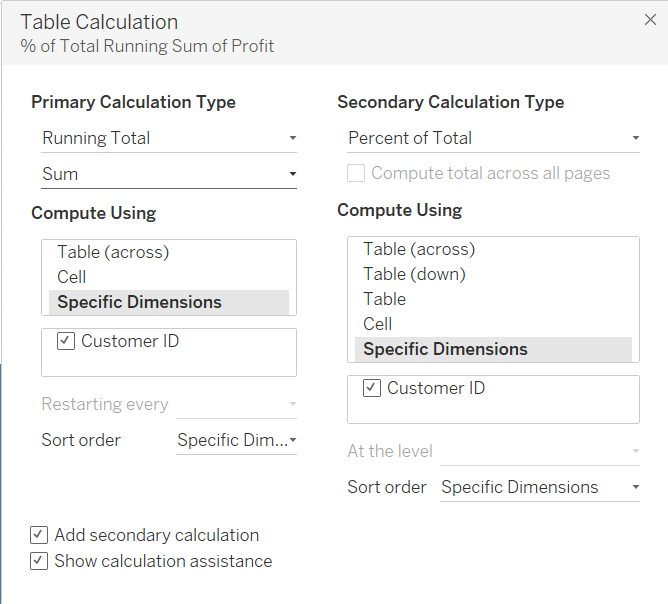
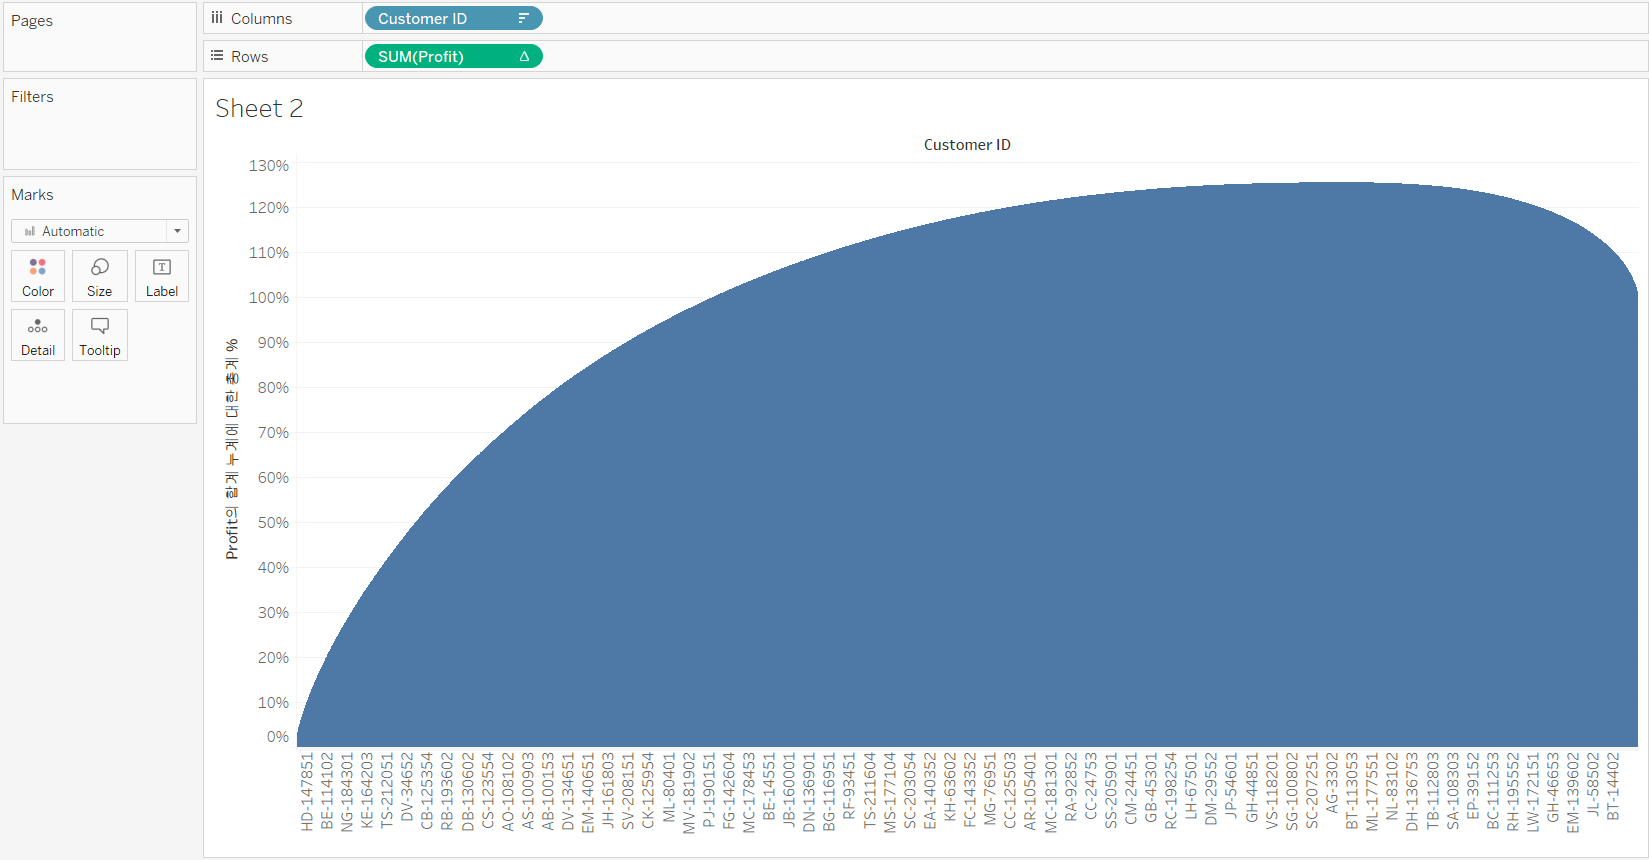
[Step 2] Use table calculations to show the percentage of total running sum of profit
- Primary calculation: [Running Total] – [Sum] / Compute using: [Specific Dimensions] – [Customer ID]
- Secondary calculation: [Percent of Total] / Compute using: [Specific Dimensions] – [Customer ID]
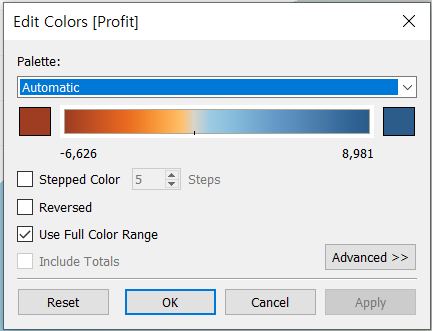
[Step 3] Color the profitable and unprofitable parts
-
Add [SUM(Profit)] to the [Color] Mark
-
Edit colors: use the full color range
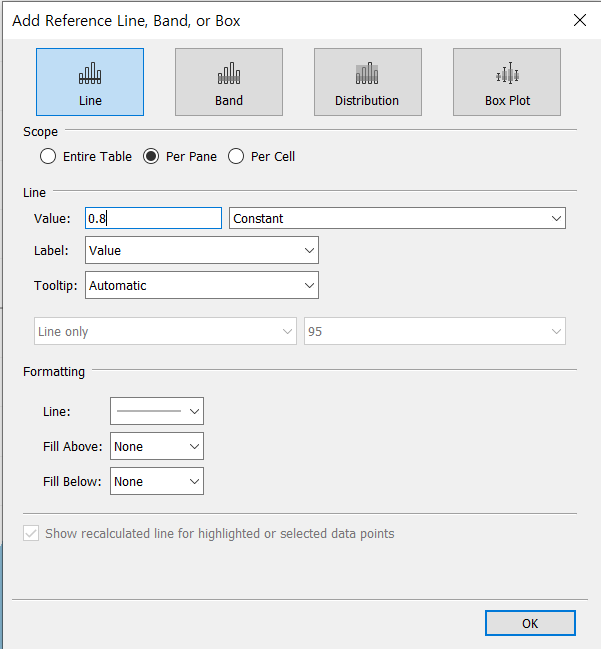
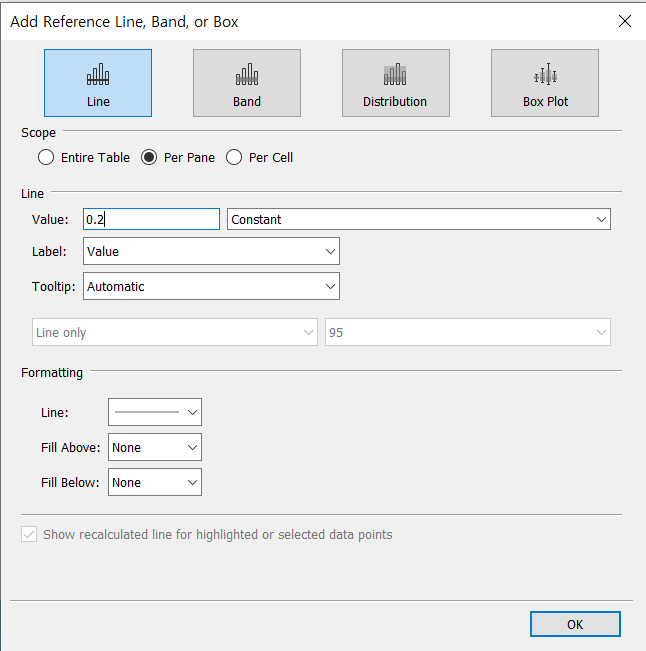
[Step 4] Add reference lines to highlight the 80/20 rules
-
[4-1] Add a 20% reference line to x-axis
To add the 20% reference line, we first need to change the x-axis (Customer ID axis) to a percent of total
-
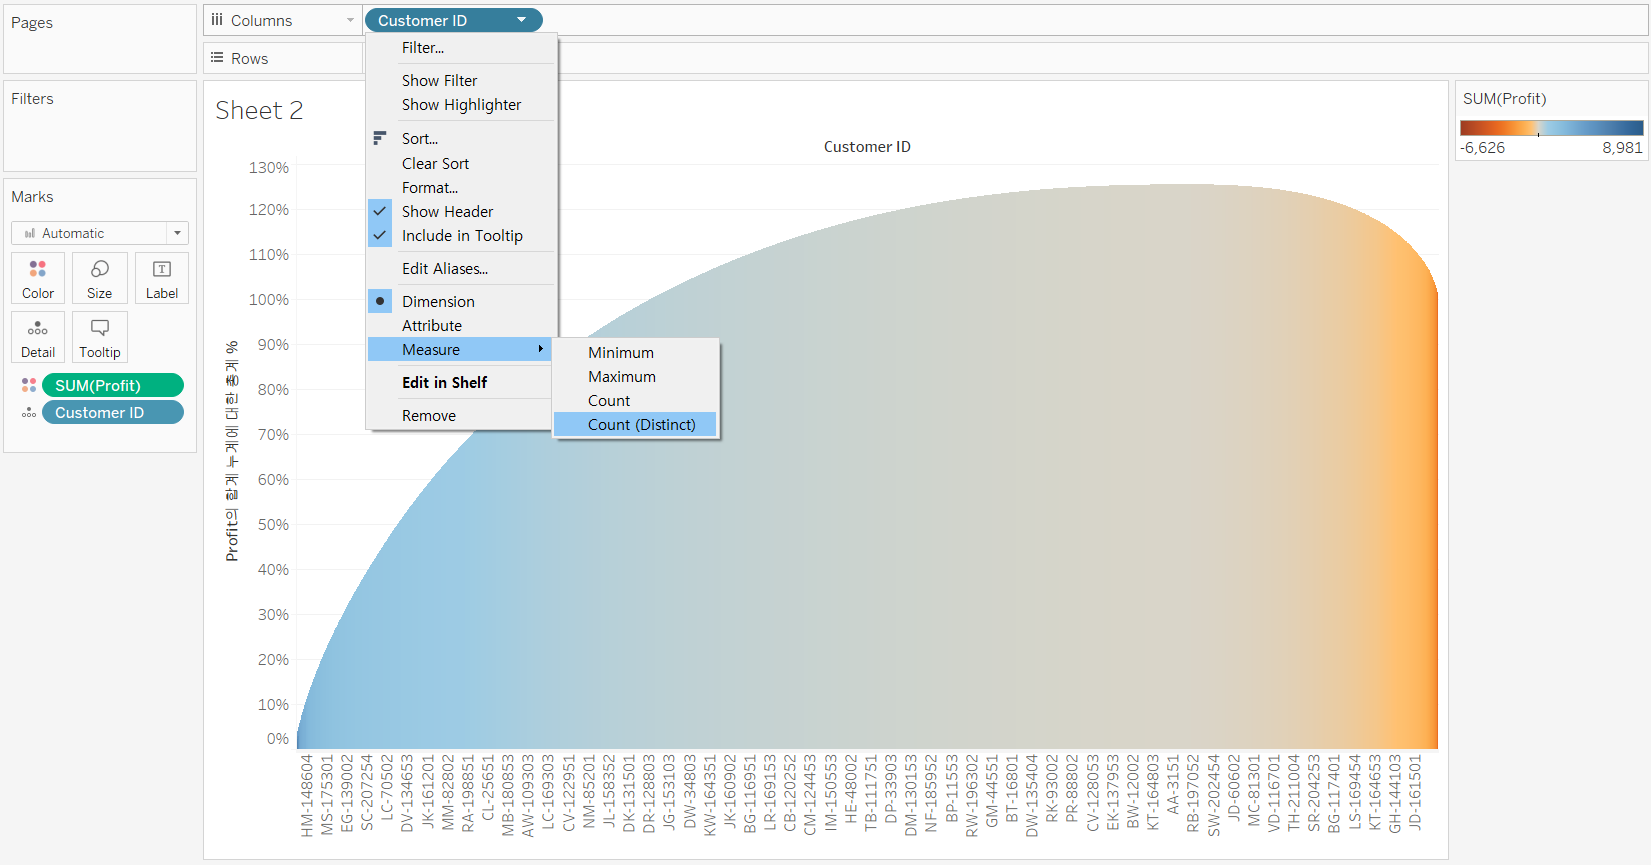
Ctrl + drag a copy of [Customer ID] to [Detail]
(Since the profit table calculation is using [Customer ID] to set the scope and direction, if there isn’t a copy of this dimension in the view, we’ll break the calculation)
-
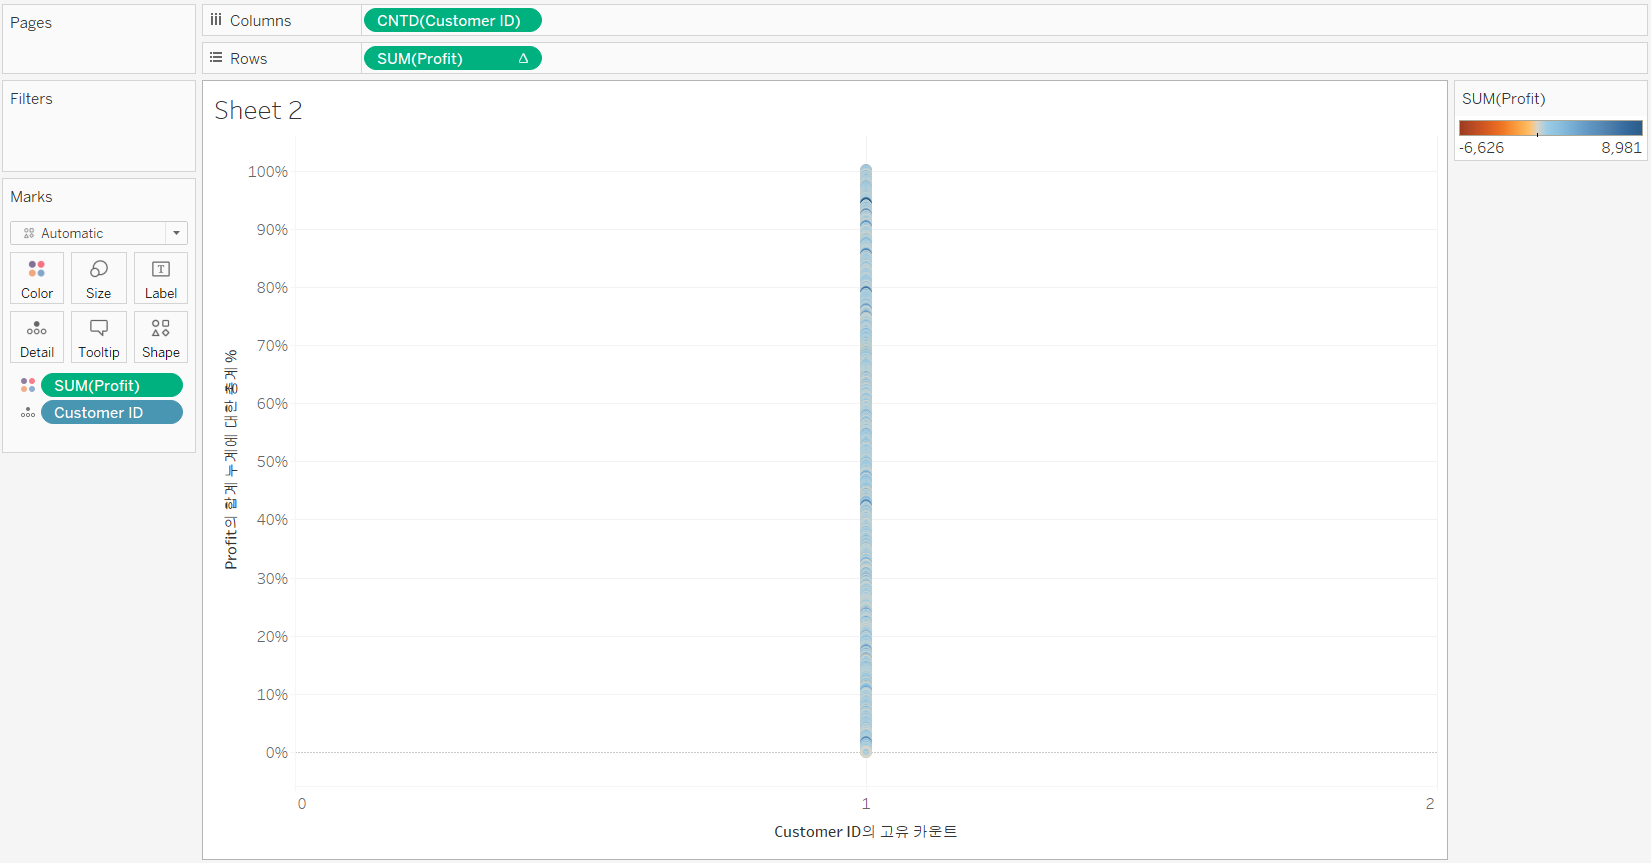
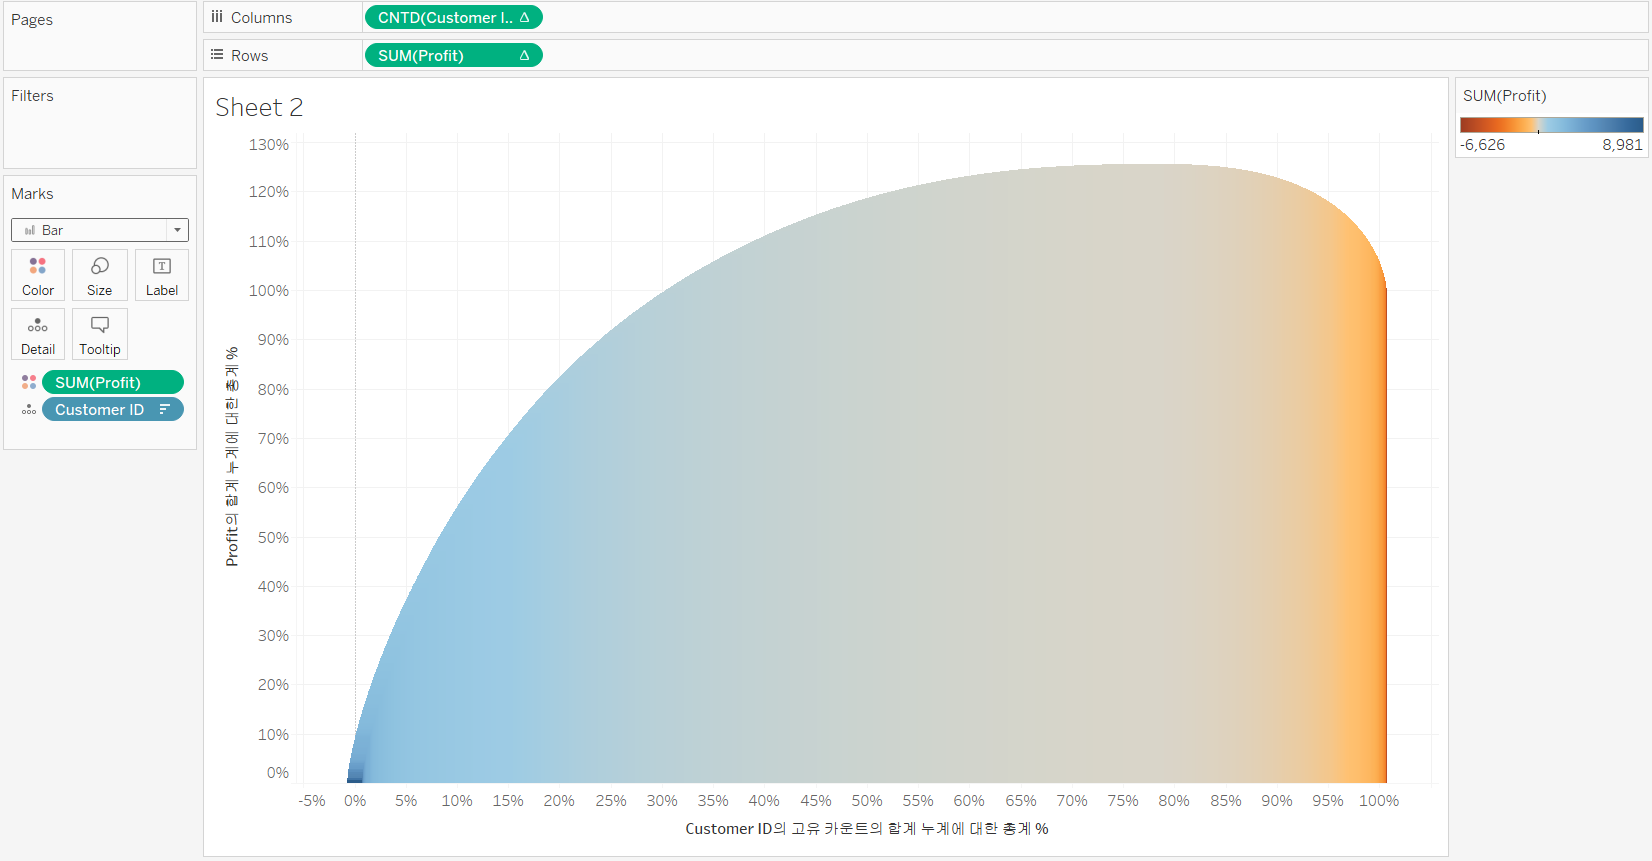
change the [Customer ID] on Columns to a Measure, showing the [Count(Distinct)]
-
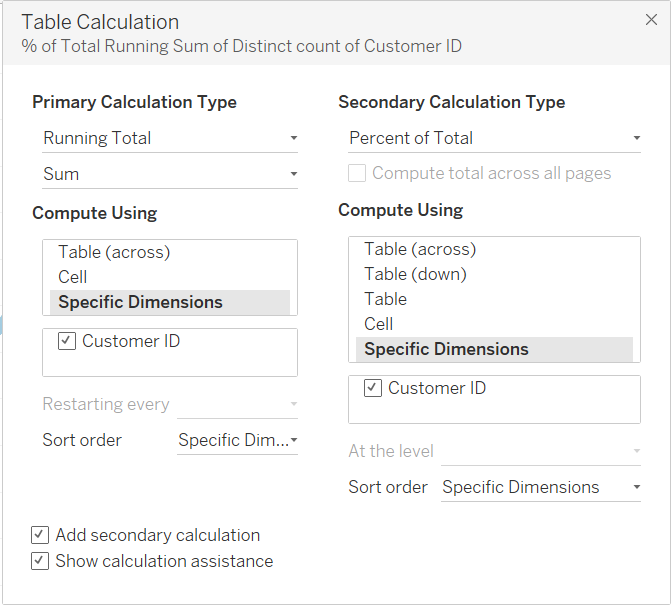
Add a similar table calculation on the Count (Distinct) of Custom ID
-
Change the mark type to Bar
-
Add a 20% reference line to x-axis and simplify the axis label.

-
-
[4-2] Add a 80% reference line to y-axis and simplify the axis label.