Customer Behavior: Analyze Survey Data
Surveys are a useful way to collect data from the people your organization serves, but the results can be challenging to visualize.
However, in Tableau Desktop, we can make survey data easier to consume by restructuring our data and visualizing it in a bar chart as follows.
>> Practice
<< Goal >>
A survey about college campus security has done in a local university, the students were asked to answer each question with one of five responses, ranging from Strongly Agree to Strongly Disagree.
We would like to know
-
how the responses were distributed by the two campuses surveyed,
-
the average response to each question,
-
and to see what areas of security need attention.
<< Process >>
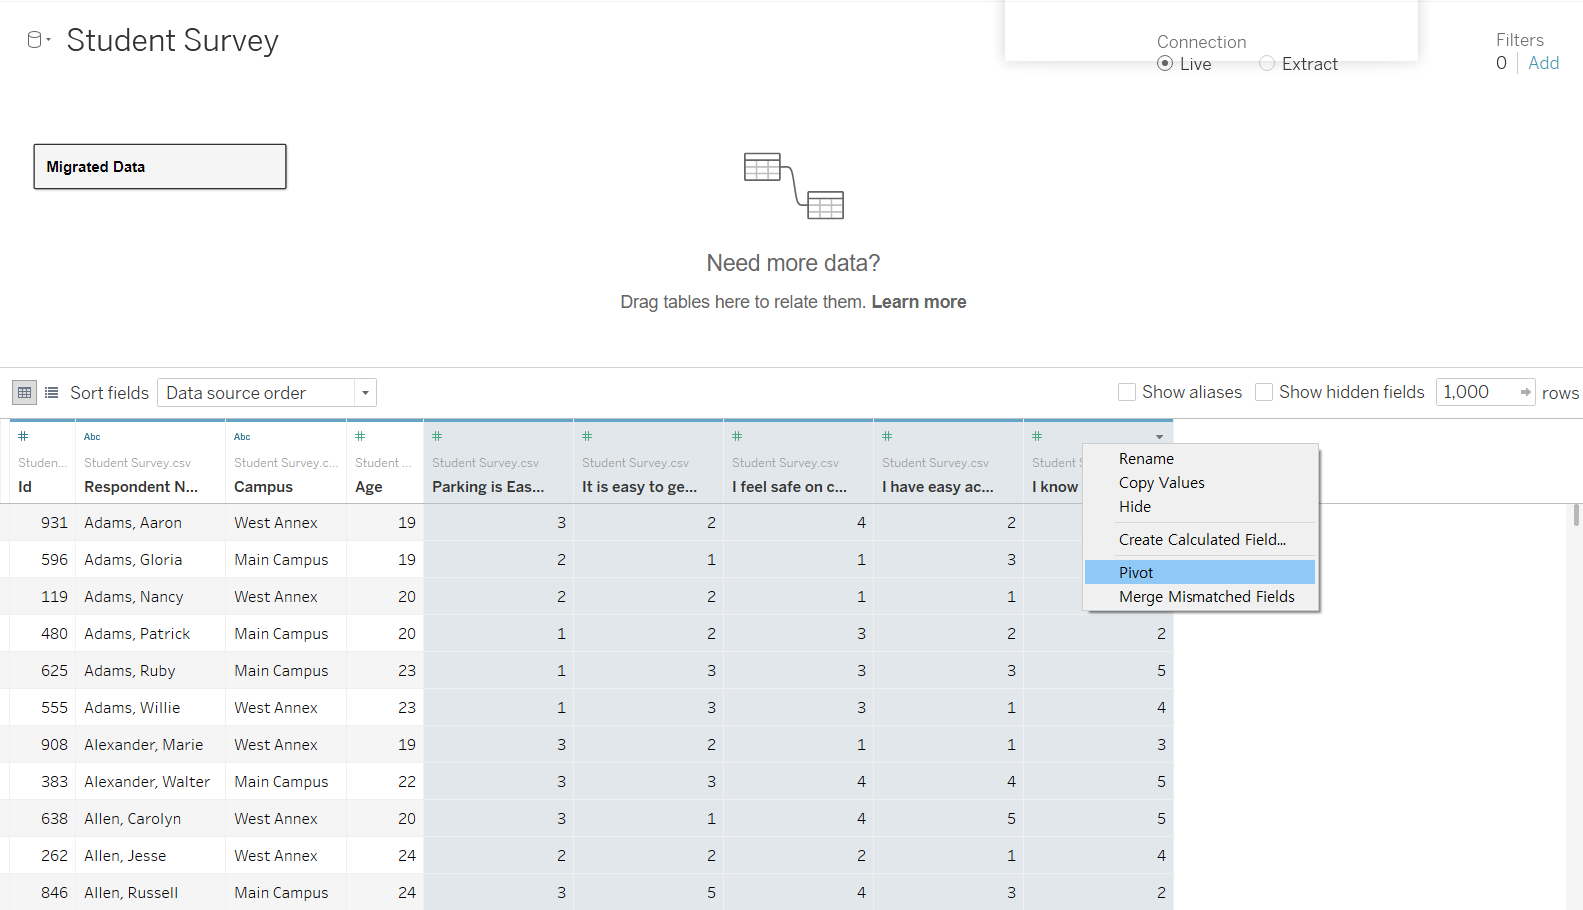
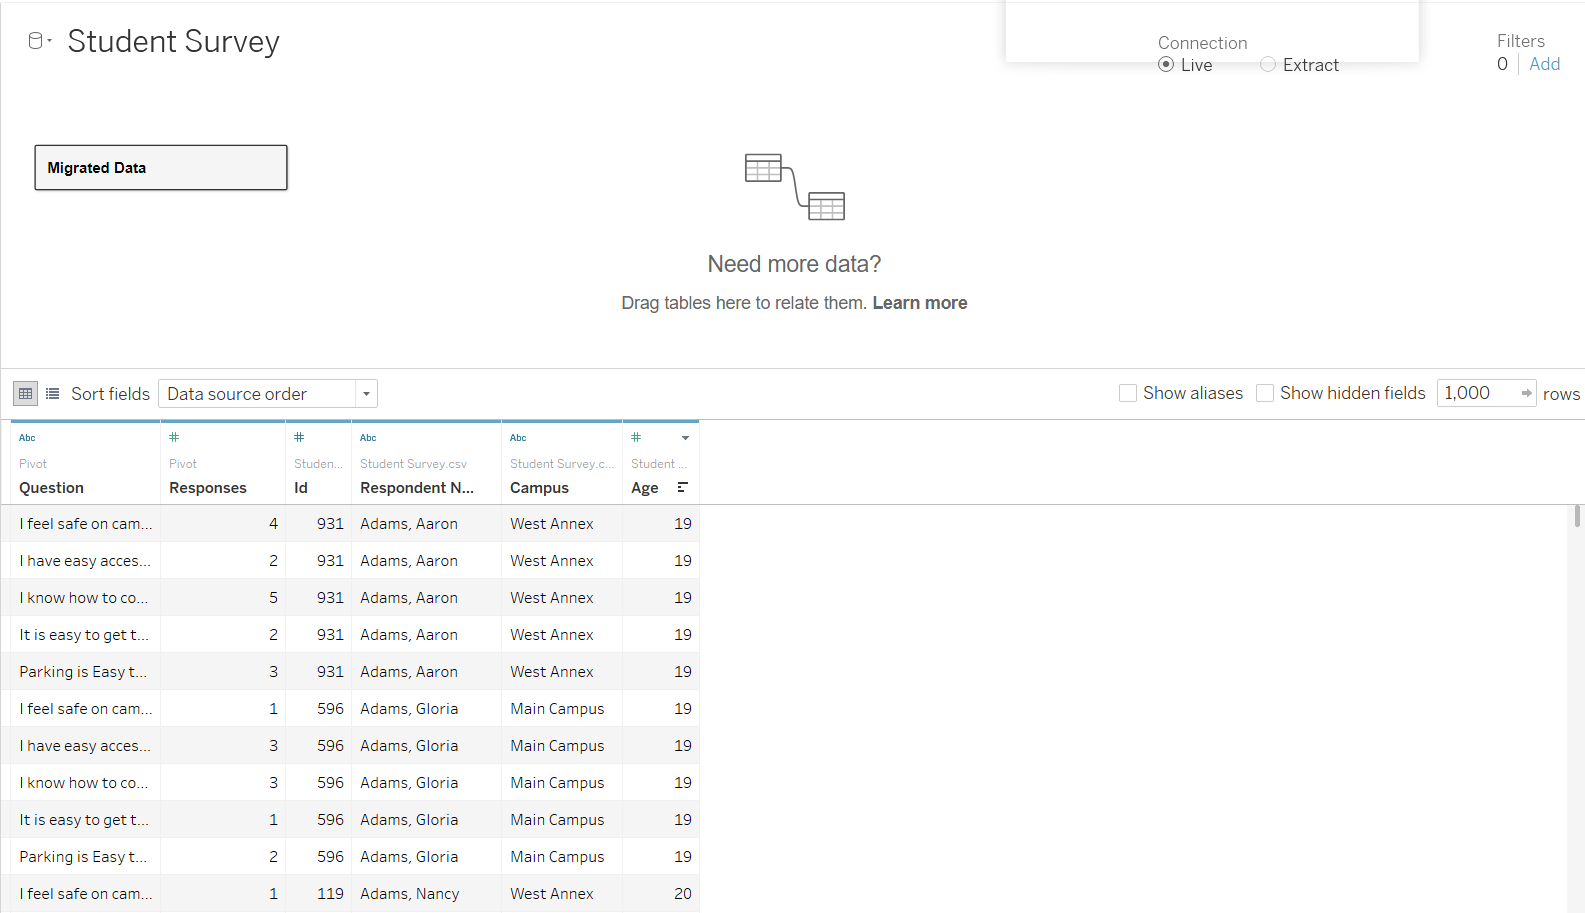
[STEP 1] Pivot the five questions: transpose data from columns to rows
-
Select the five questions fields --> Right-click --> Pivot
-
Rename the new fields “Question” and “Responses”
[STEP 2] First looking at the data as a whole
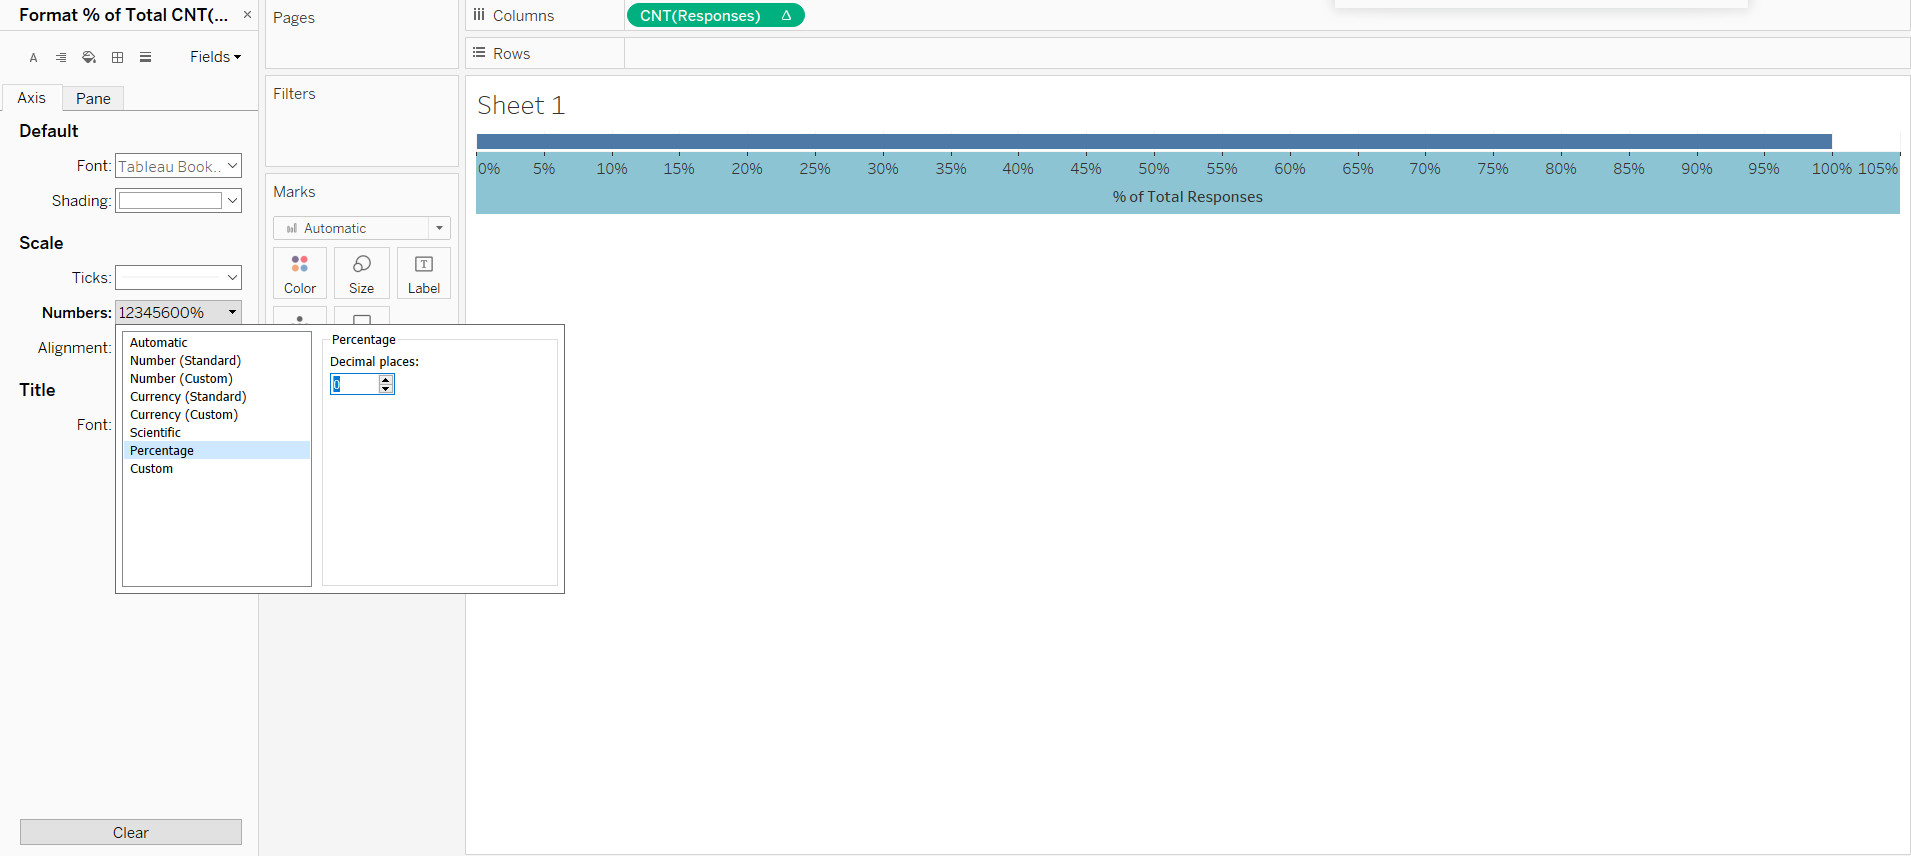
Show the total percentage of responses:
-
Drag Responses to Columns --> Change the aggregation to Count --> Add a [Percent of Total] Quick Table Calculation
-
Change the axis title and format the label so it does not display decimal places
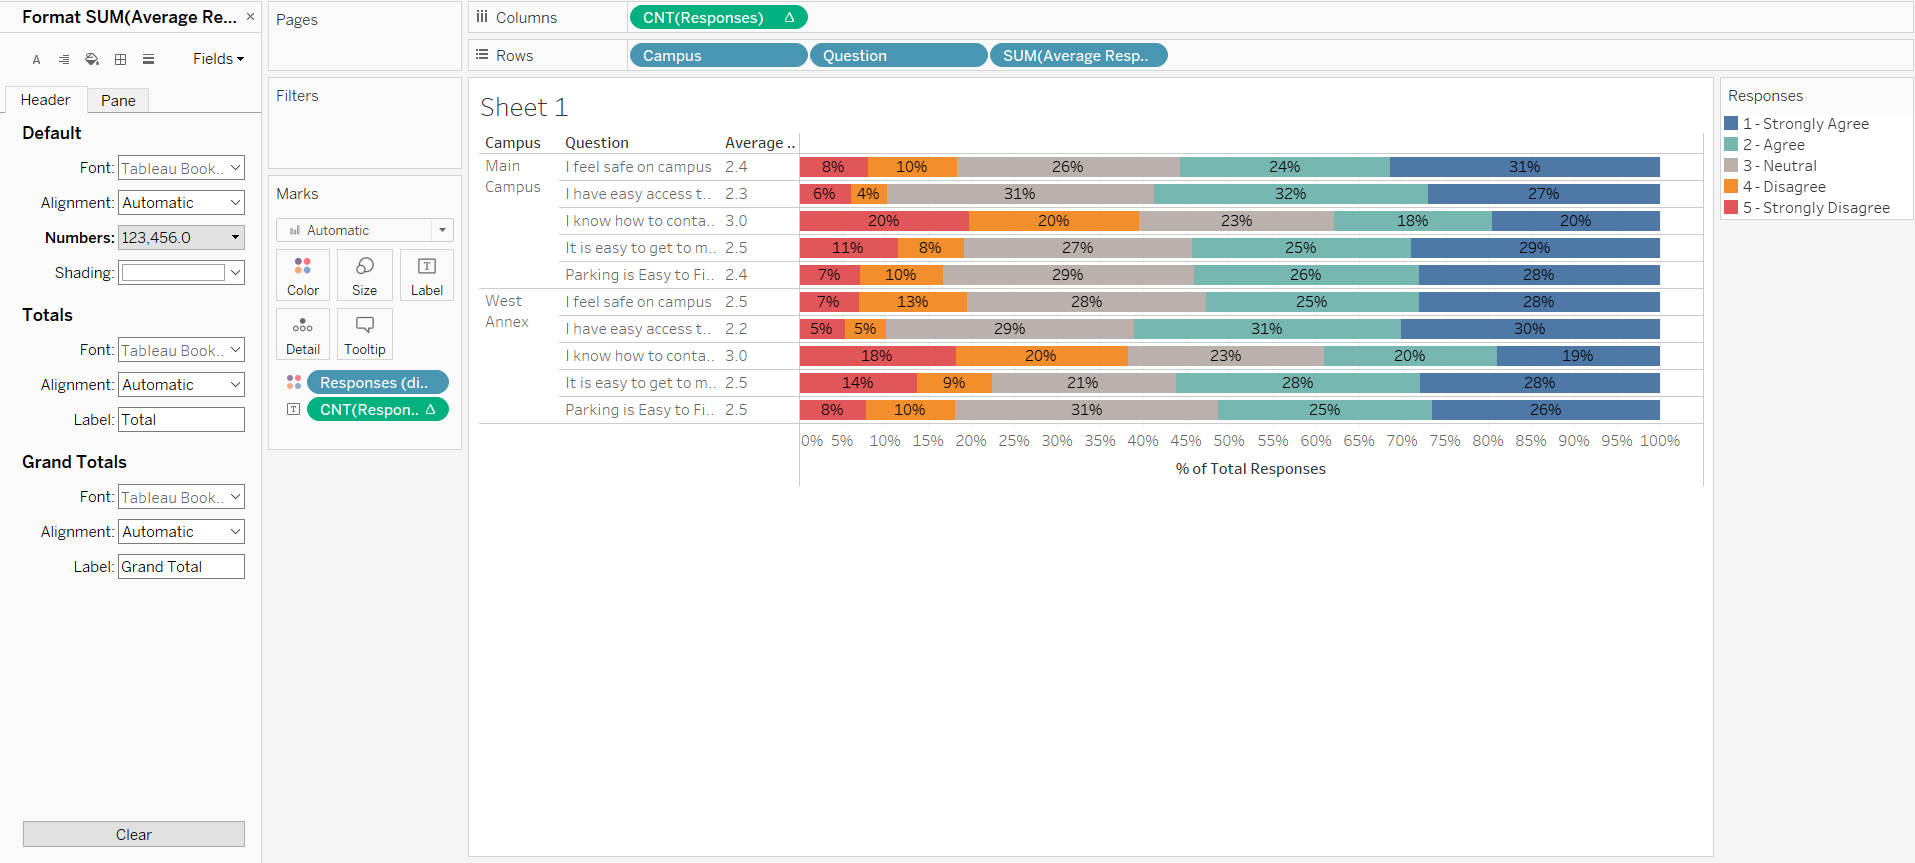
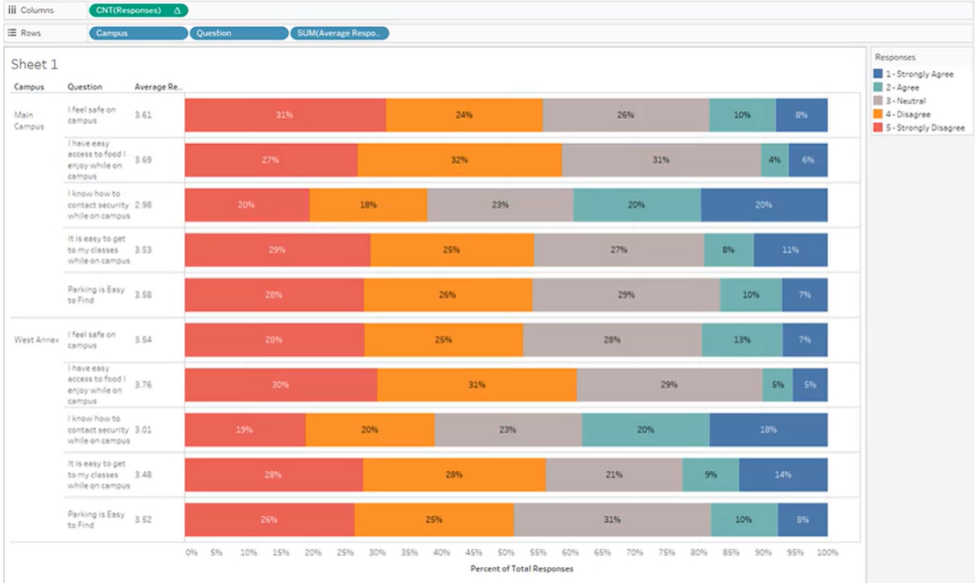
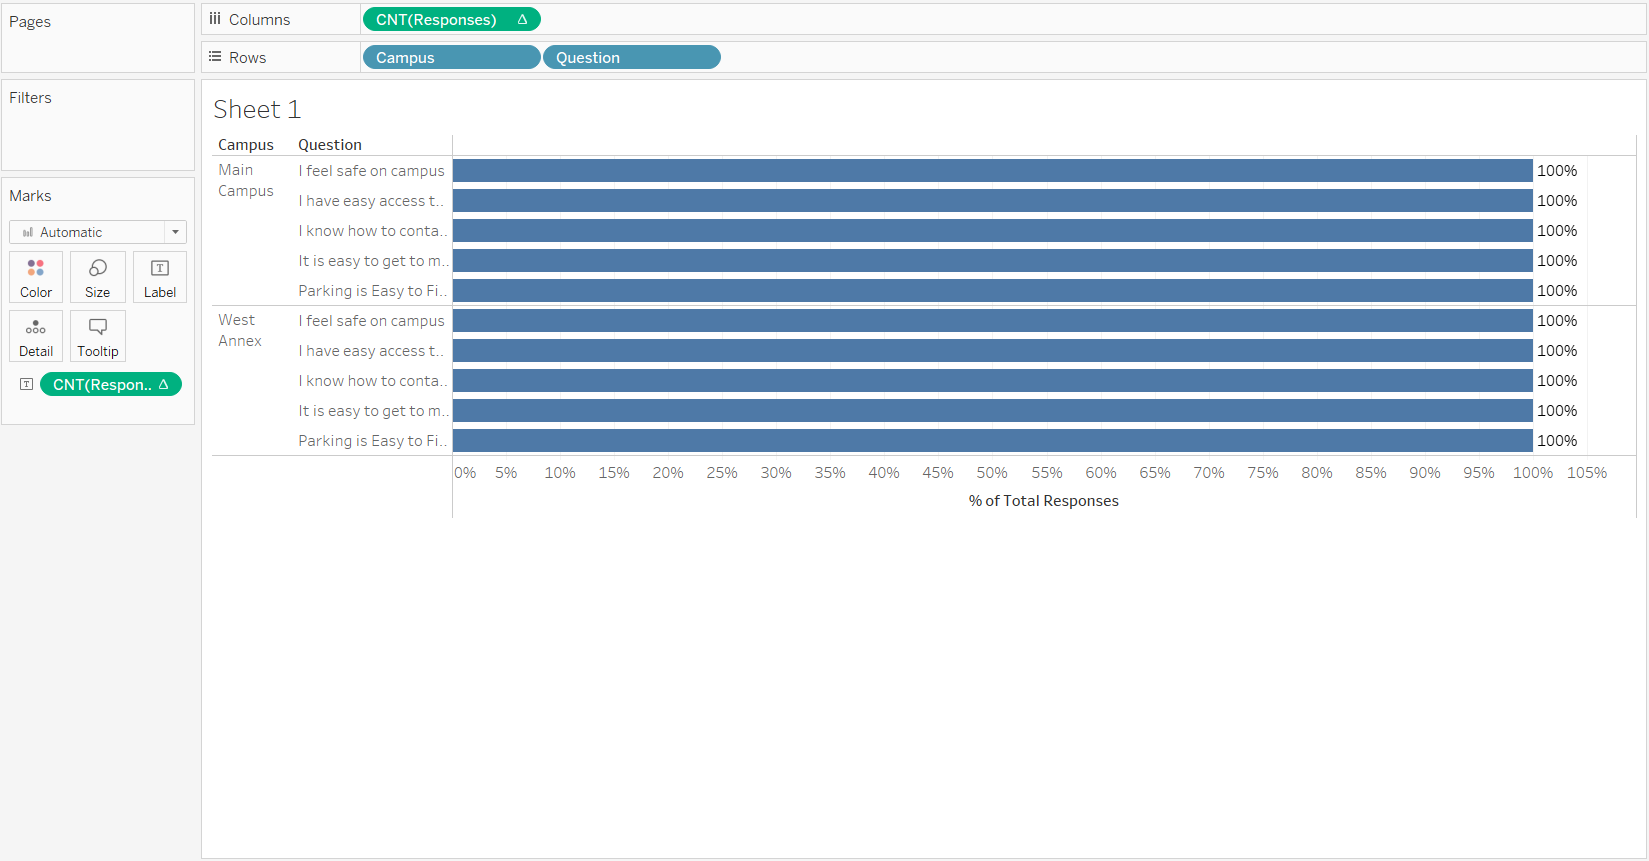
[STEP 3] Break down the responses by Campus and Questions
[STEP 4] Color the bars by Responses
-
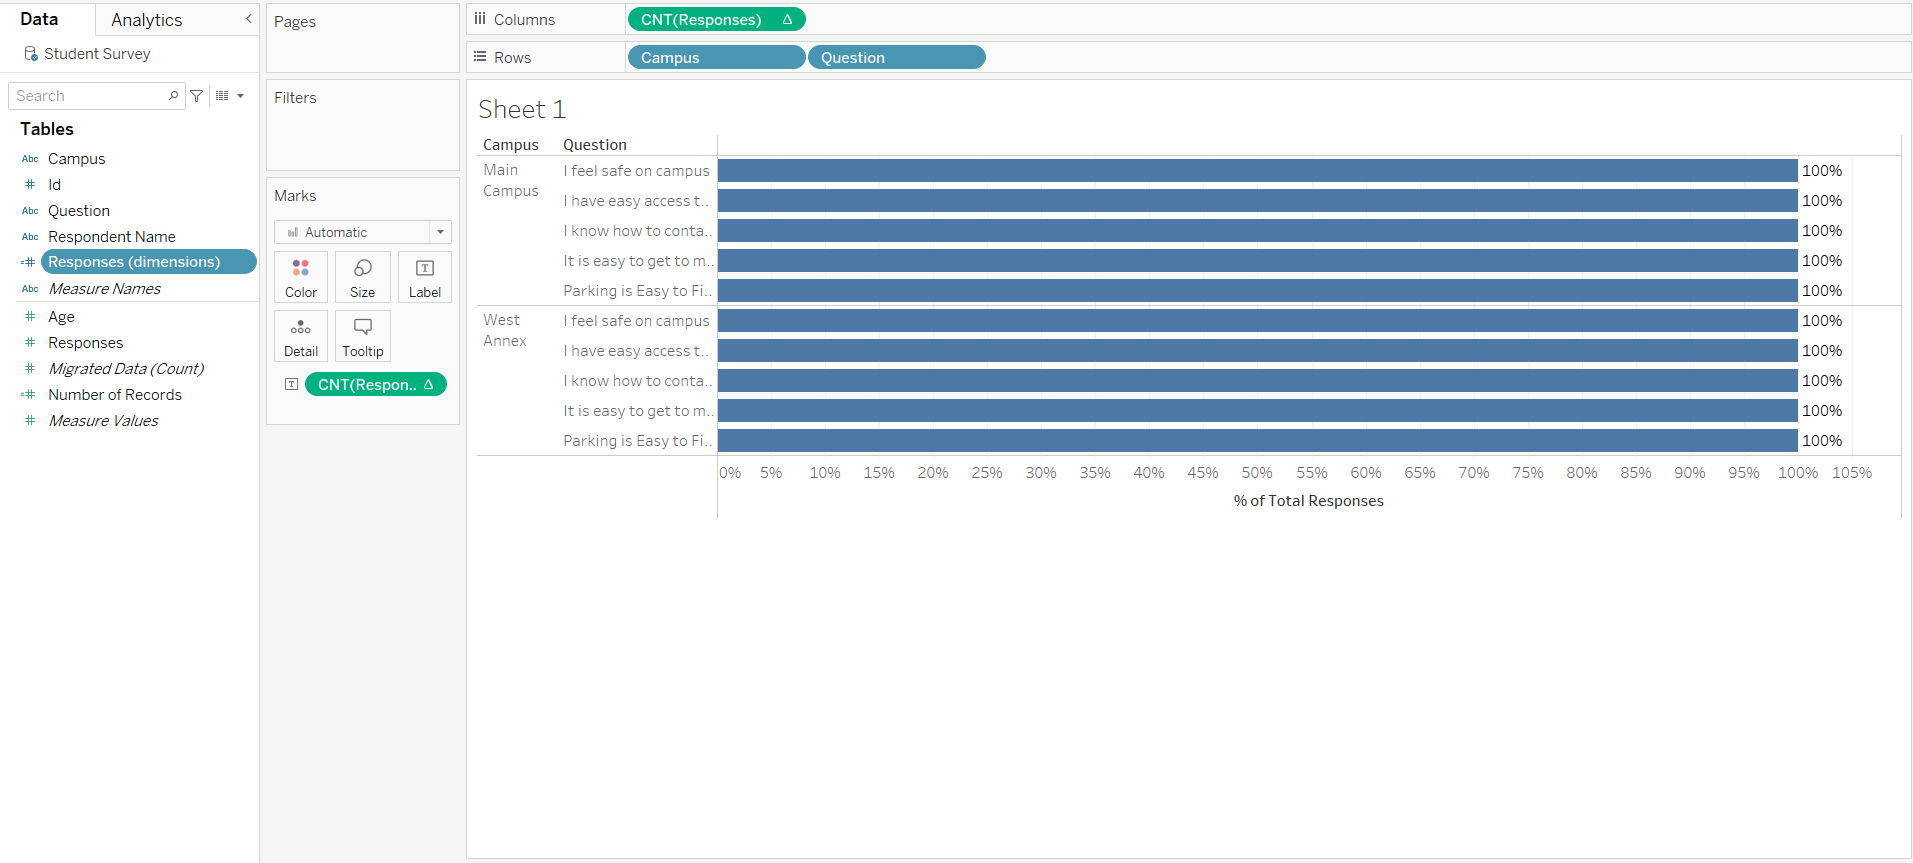
Make a copy of the [Responses] field, convert it to a dimension, and rename it [Responses (dimensions)]
-
Color the view by [Responses (dimension)] and rename the aliases to match the survey
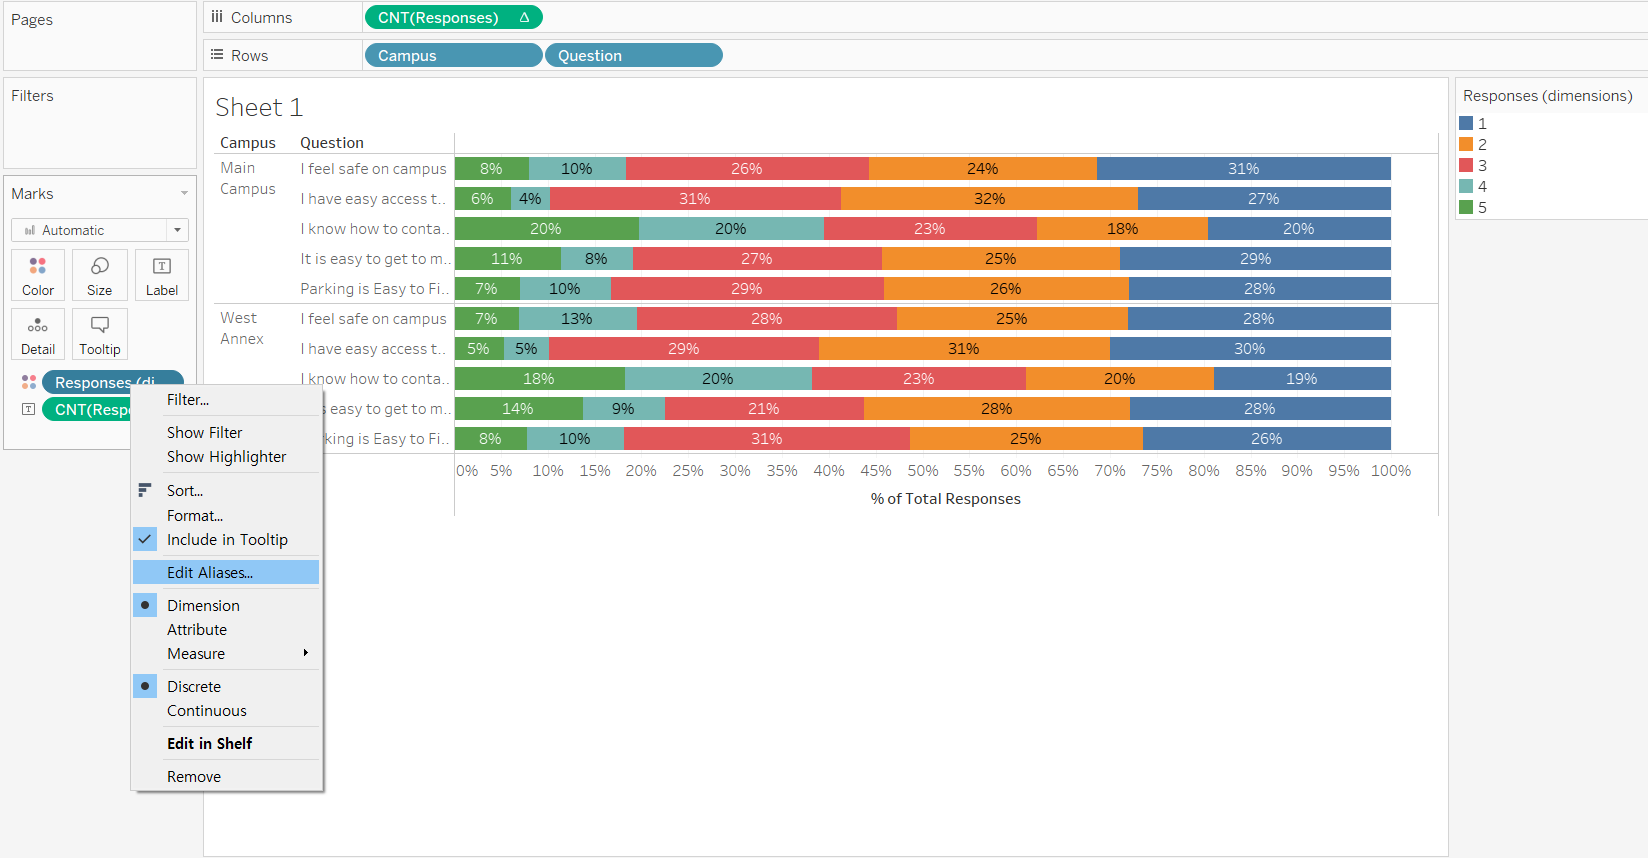
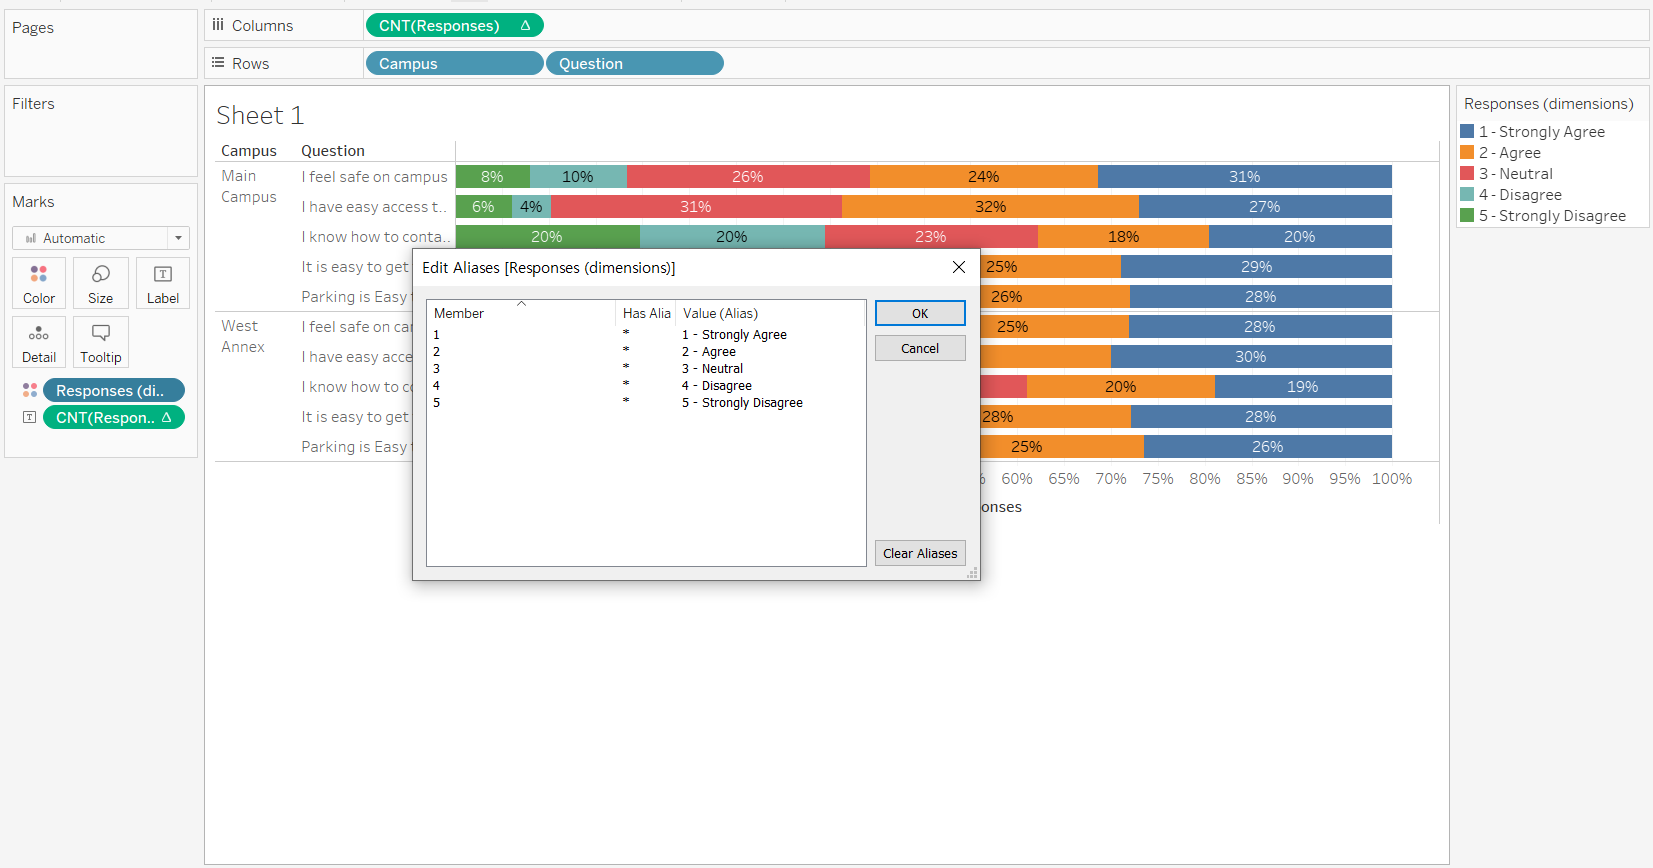
-
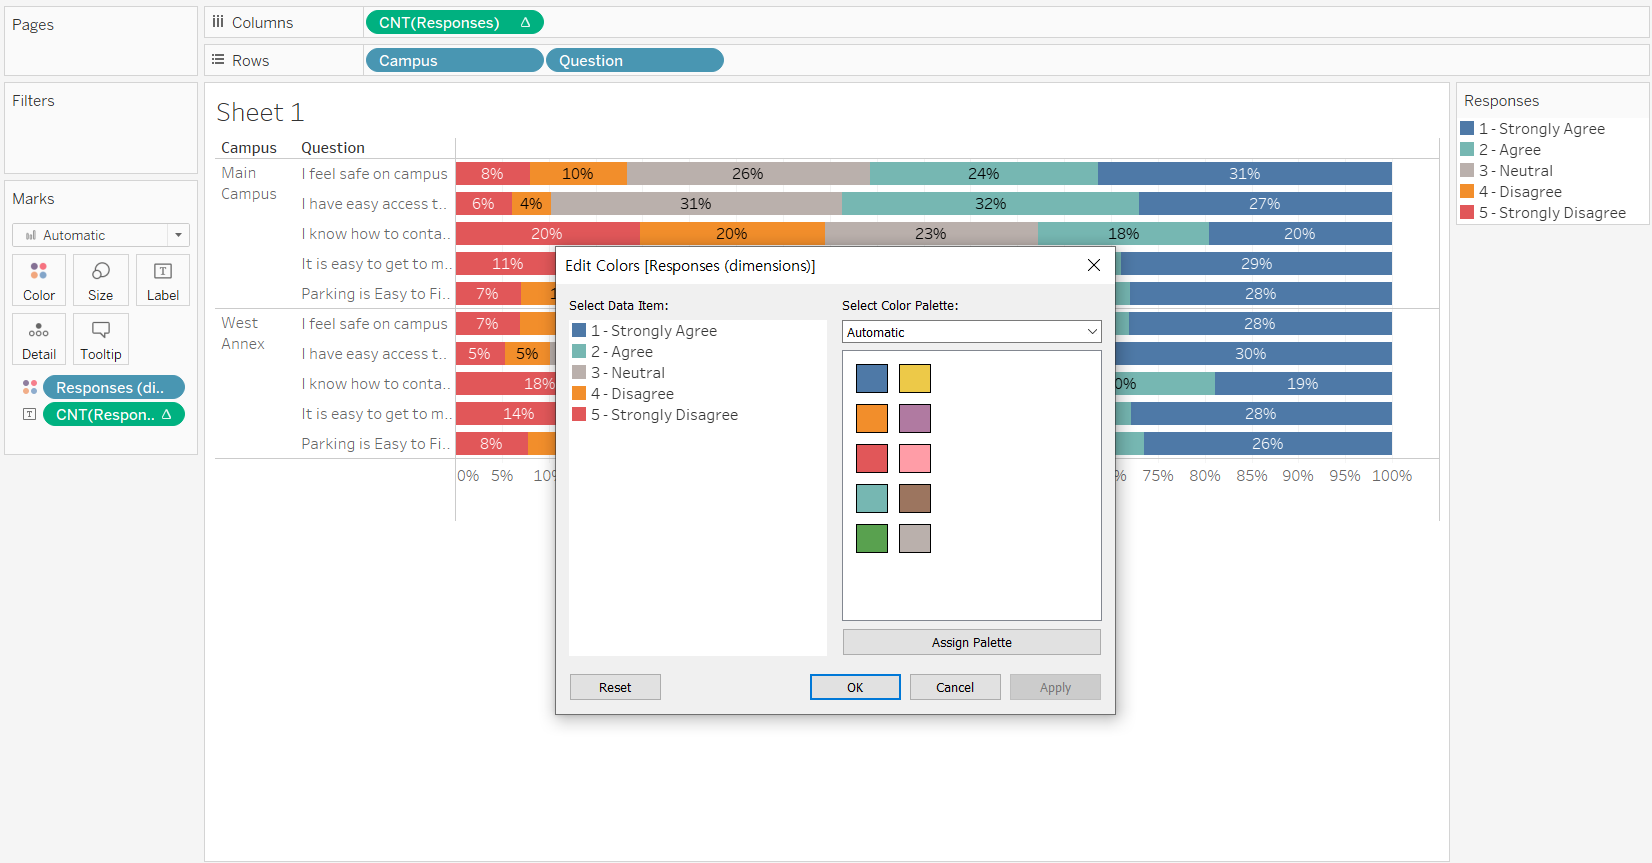
Edit legend colors and change the title to Responses
[STEP 5] Calculate the average response to each question
-
Create a calculated field, fixed on Campus and Question, to determine the average response
[Average Response] :
{ FIXED [Campus], [Question] : AVG([Responses]) }
-
Add [Average Response] to rows, make it discrete, and format it so it has one decimal place