Introduction to Tableau Desktop
>> Process in Tableau Desktop
Connecting To Your Data --> Analyzing Your Data --> Sharing Your Analysis
>> Several Ways to Build Visualizations
- Dragging or double-clicking to put fields on Rows or Columns.
- Dragging fields to the Marks card.
- Dragging fields to the View.
- Selecting fields and clicking on a chart type in Show Me.
>> Build a Dashboard
-
Select worksheets to show in the dashboard
-
Fine-tune a dashboard
-
Adjust the views to fit the dashboard space
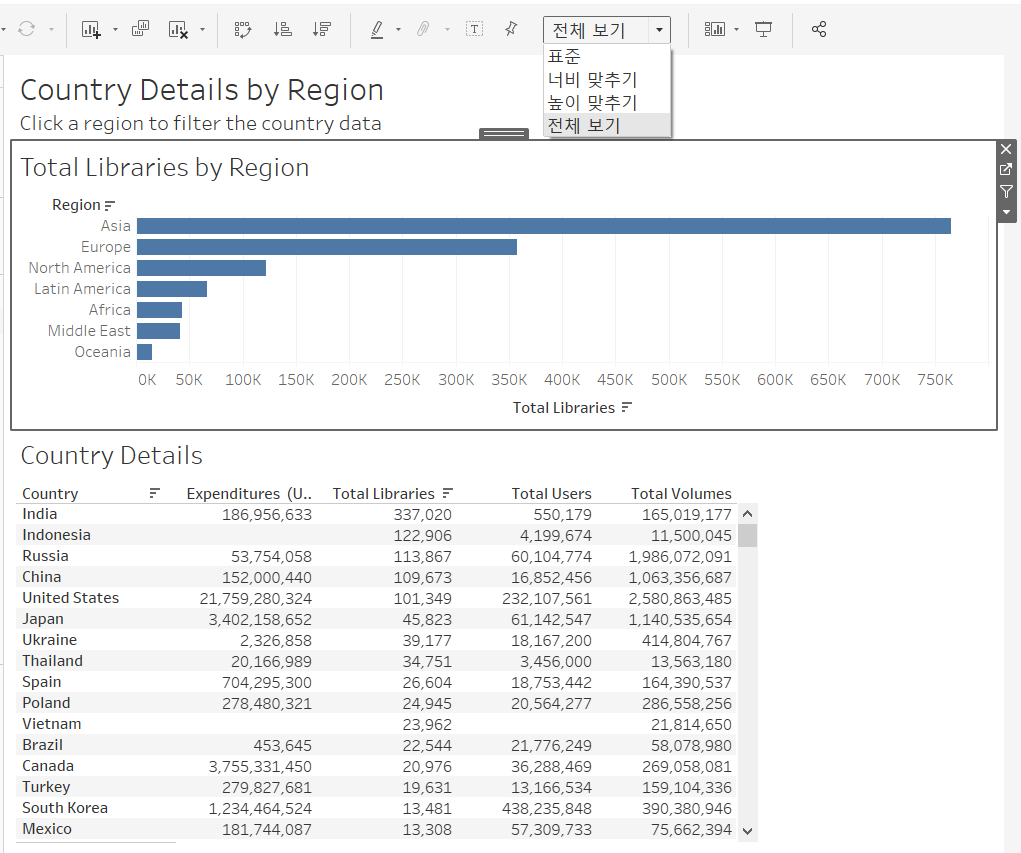
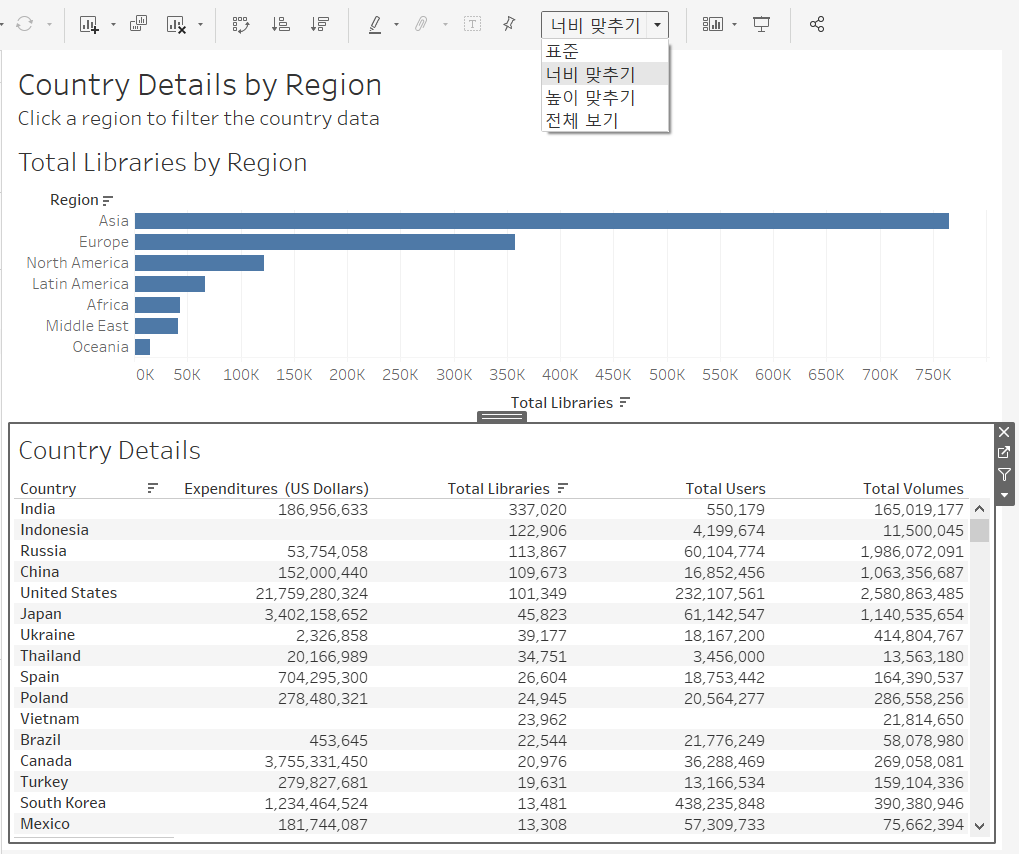
-
Set a chart to be used as a filter for other charts
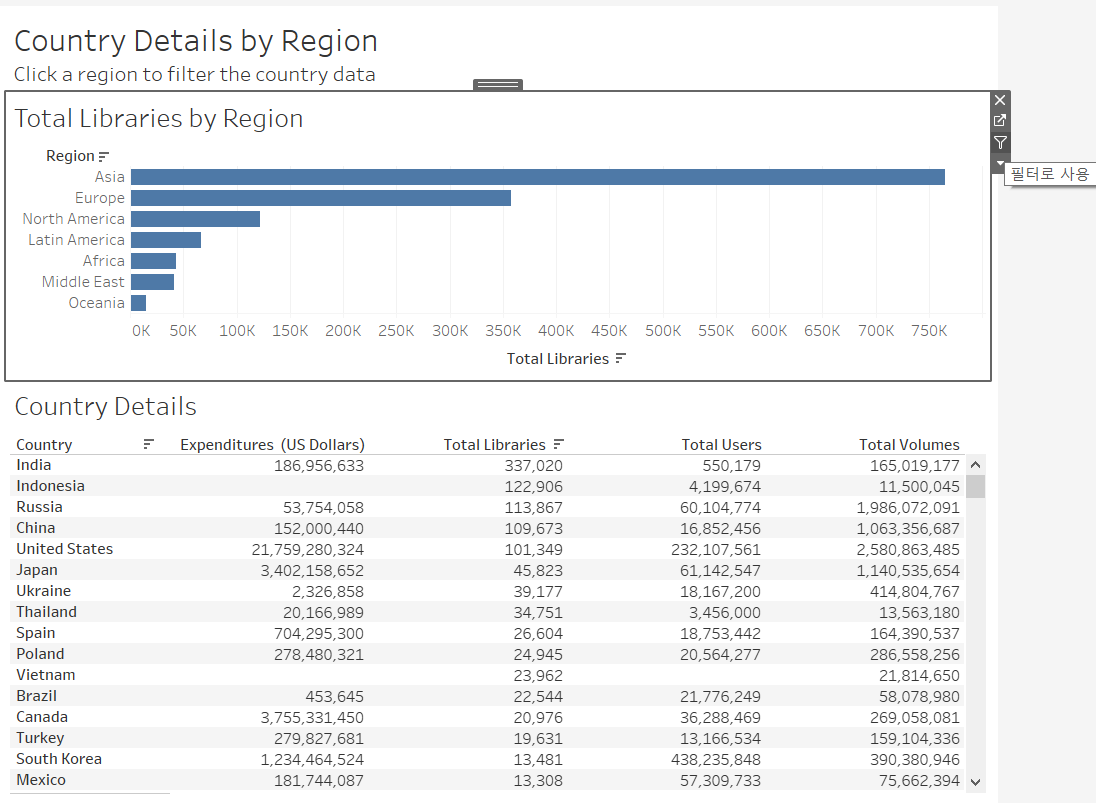
-
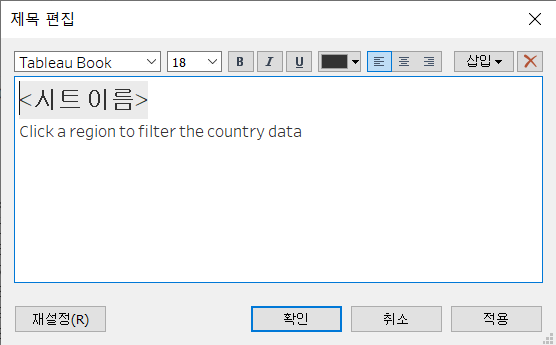
Add a dashboard title and instructions
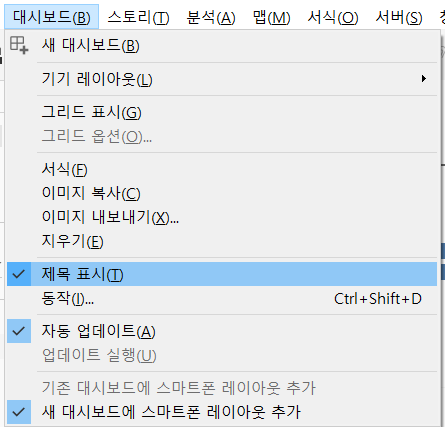 – Double Click the Title--
-
-
Save a dashboard
- .twb (Tableau Workbook) : without copy of the data source file
- .twbx (Tableau Packaged Workbook) : includes a copy of the data file and any other source files
