Showing the Breakdowns of the Whole (Pie Chart & Tree Map)
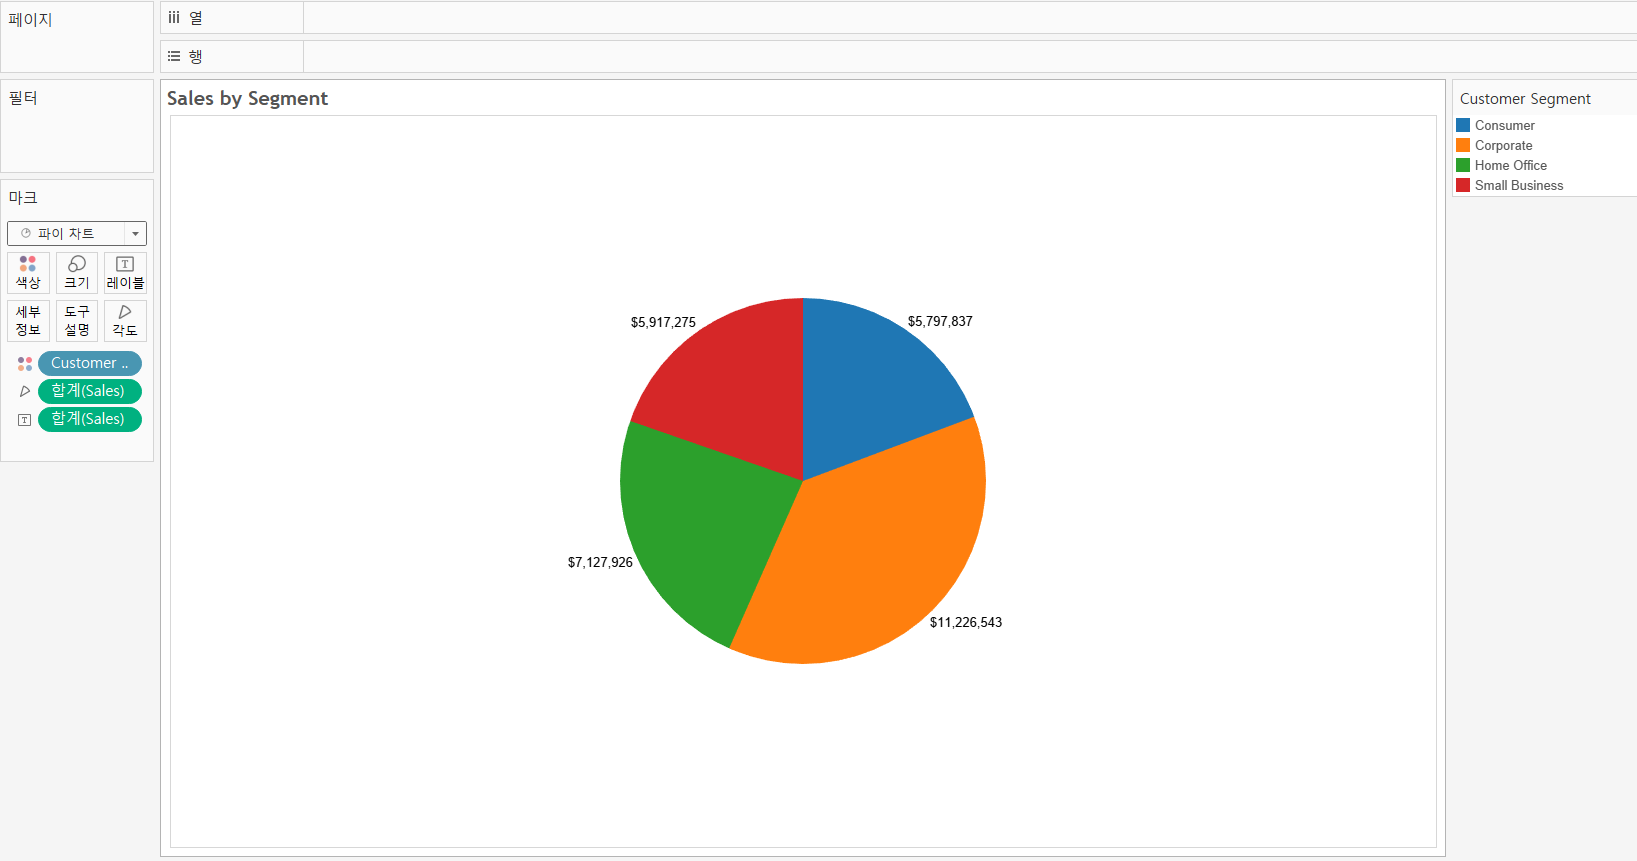
1. Pie Chart
>> Create a pie chart
Method 1: Use Marks
- Mark : Pie Chart
- [Color] : dimension field [best: within 5 dimension members]
- [Angle] : measure field
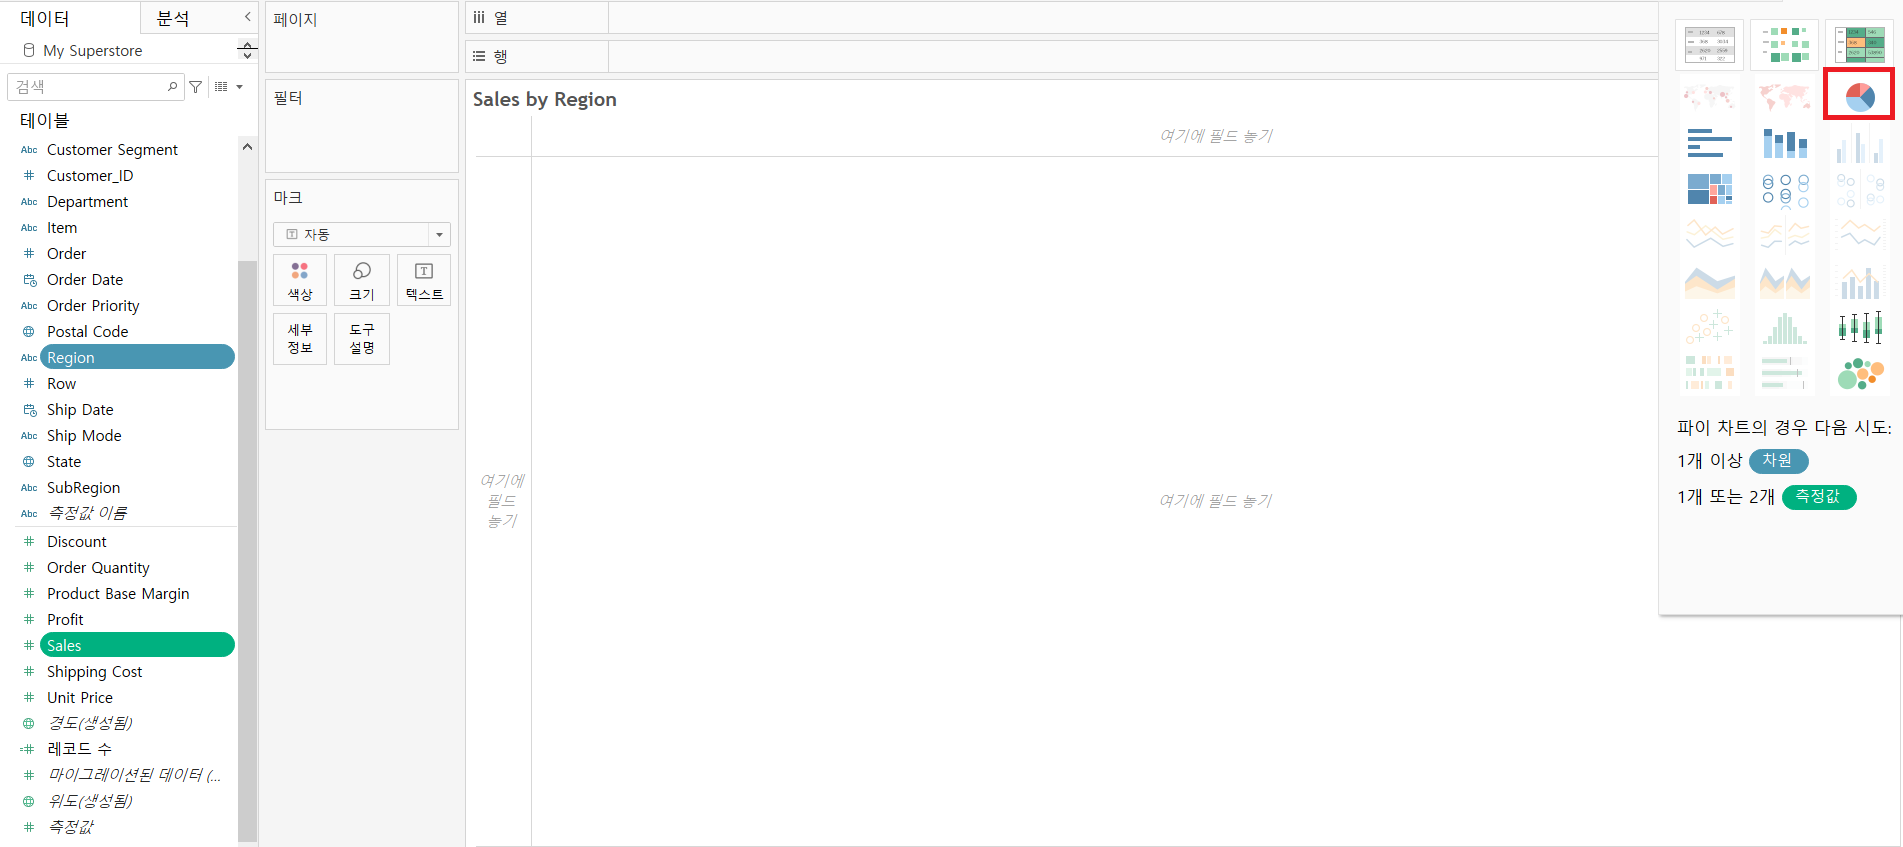
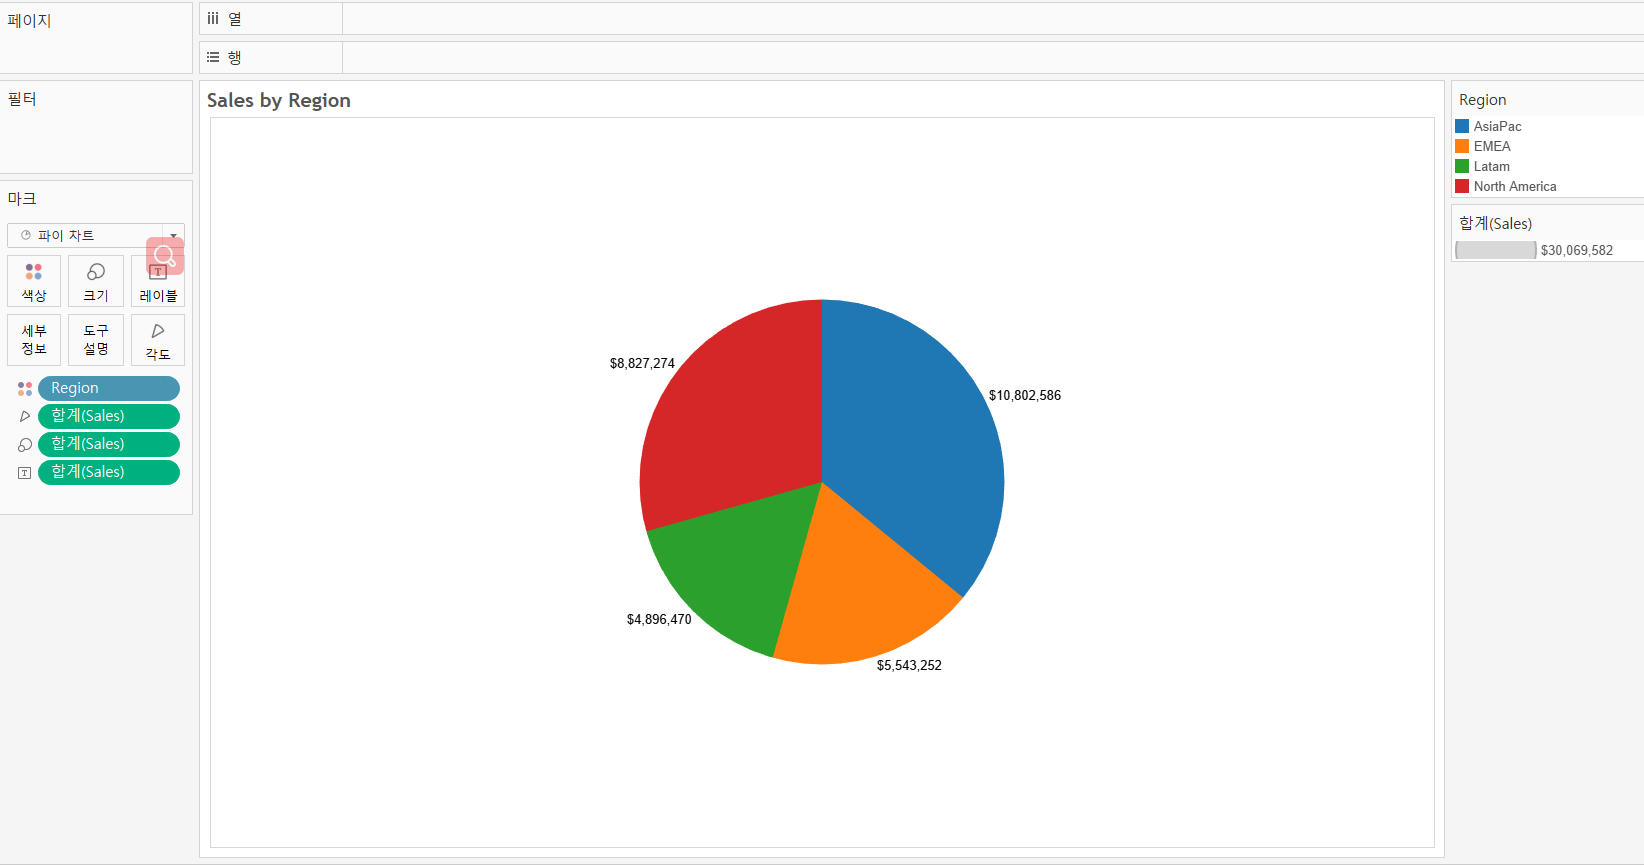
Method 2: Use [Show Me]
- Choose [dimension field] and [measure field]
- click [Show Me] --> [Pie Chart]
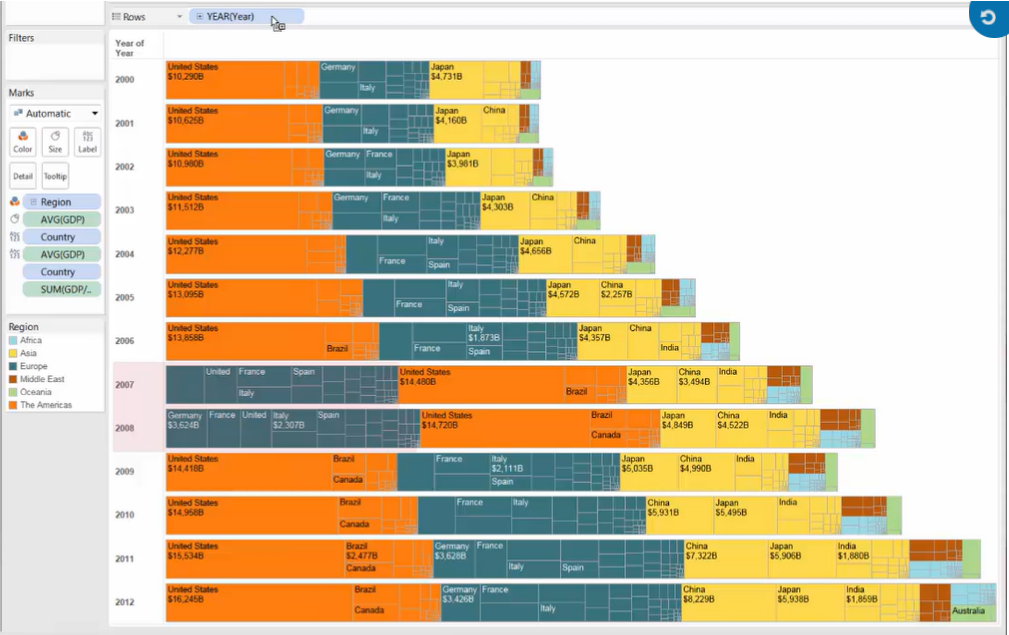
2. Tree Map
If you have hierarchical data, or data with more than 5 dimension members, a pie chart is not ideal. Instead, a treemap may be a good choice.
Treemaps:
- using [nested rectangles] to show [hierarchical data] as a part of the whole
- the square shape helps your eye to compare relative sizes
>> Build a treemap
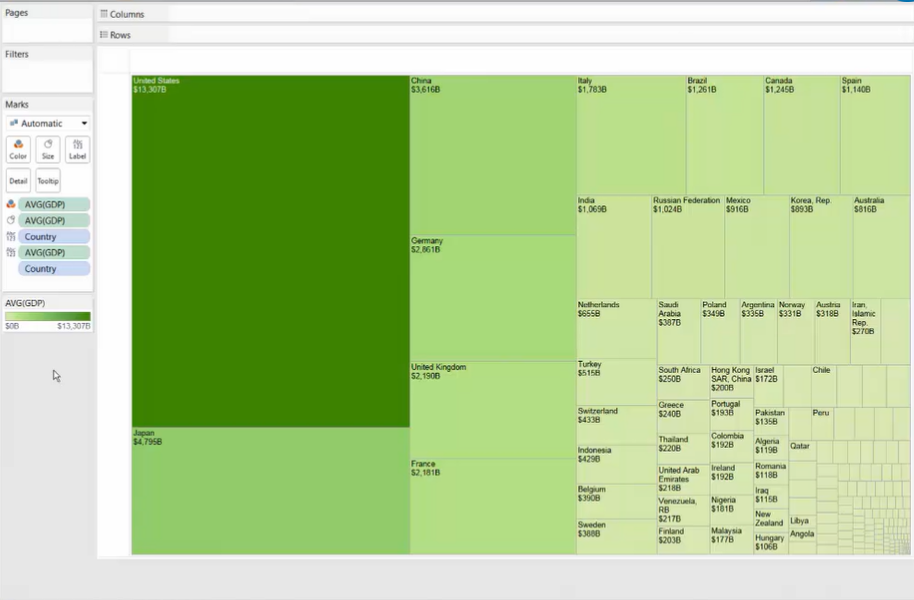
Style 1: one dimension
- [Color] & [Size] : 1 measure field
- [Detail] : 1 dimension field
- [Label] : measure & dimension
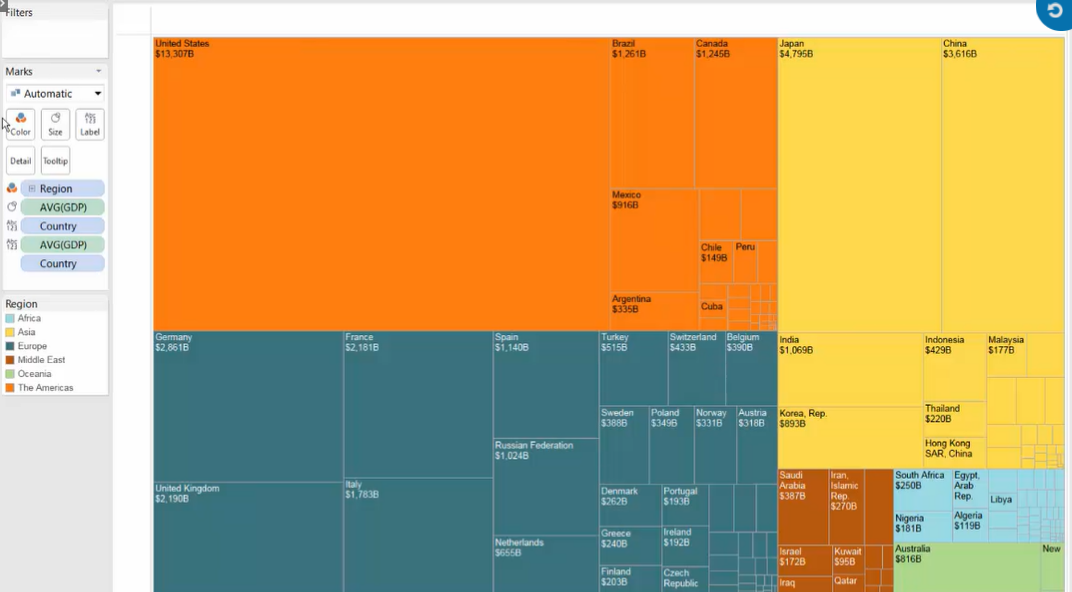
Style 2: two dimensions (hierarchical data: Region -> Country)
- [Color] : 1st dimension field (Region) [best: within 7 colors]
- [Size] : 1 measure field
- [Detail] : 2nd dimension field (Country)
- [Label] : measure & dimensions
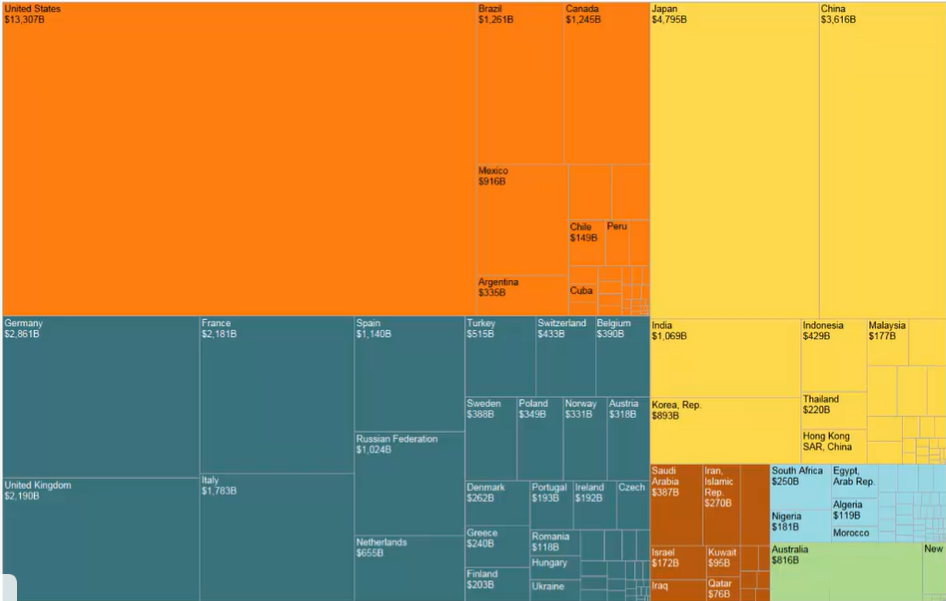
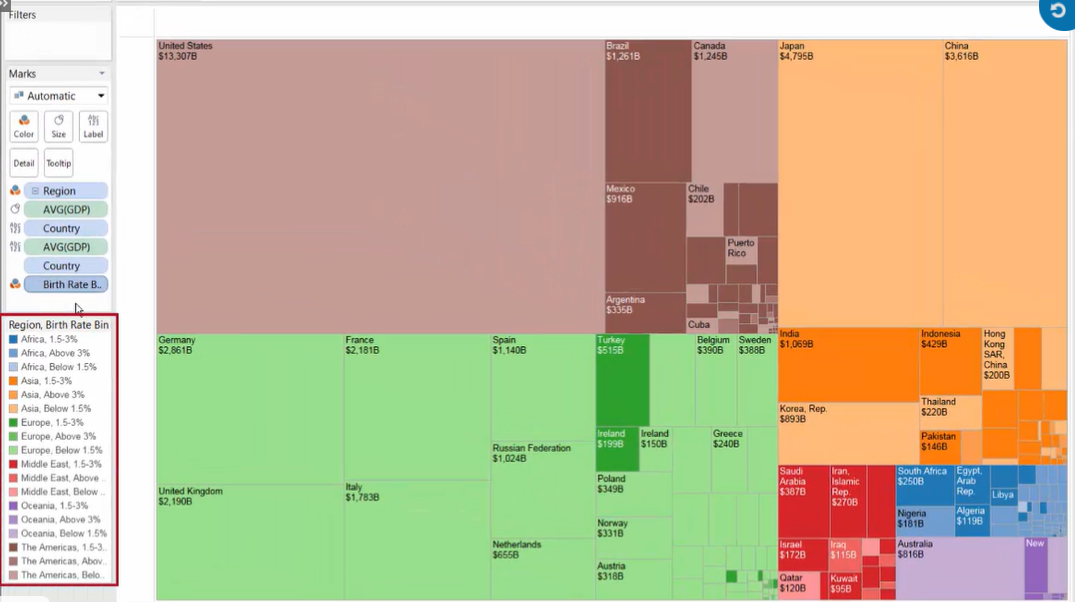
Style 3: add a second color (3 dimensions)
- [Color 1] : 1st dimension field (Region)
- [Size] : 1 measure field
- [Detail] : 2nd dimension field (Country)
- [Color 2] : 3rd dimension field (Birth Rate Bin) [add shades of color]
- [Label] : measure & dimensions
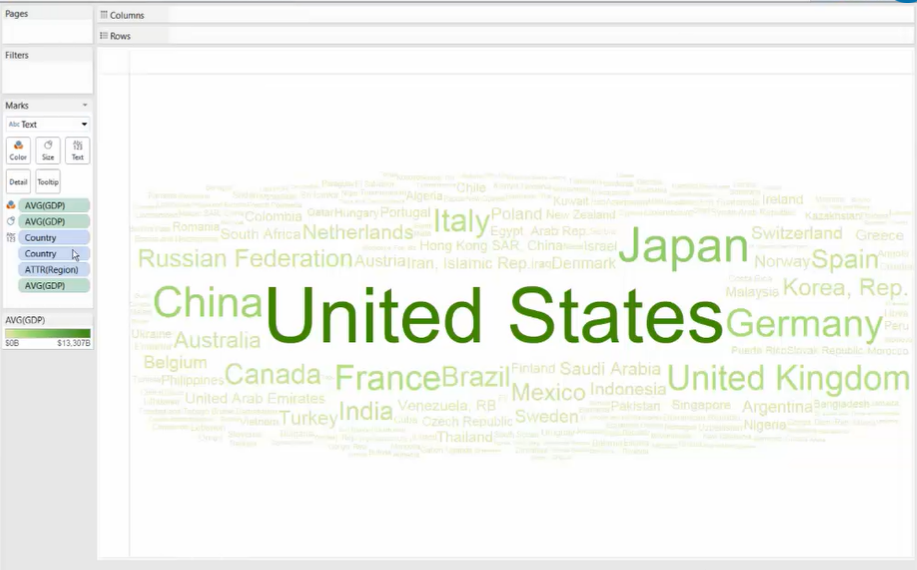
Style 4: Word Cloud
Treemap --> change the Marks to [Text]
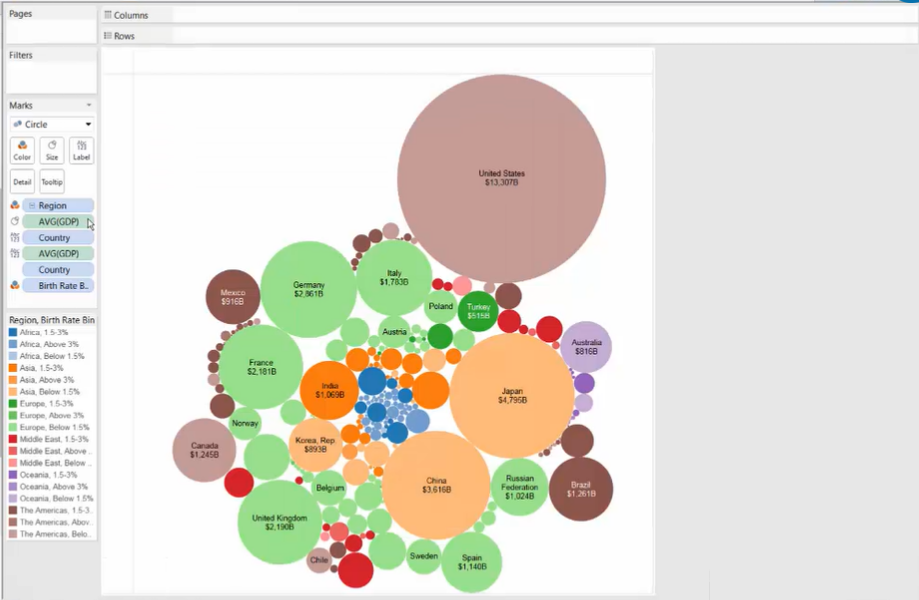
Style 5: Bubble Chart
Treemap --> change the Marks to [Circle]
Style 6: add a dimension to rows