Highlighting Data with Reference Lines
>> Reference Line
2 ways to add reference line
-
From the view:
-
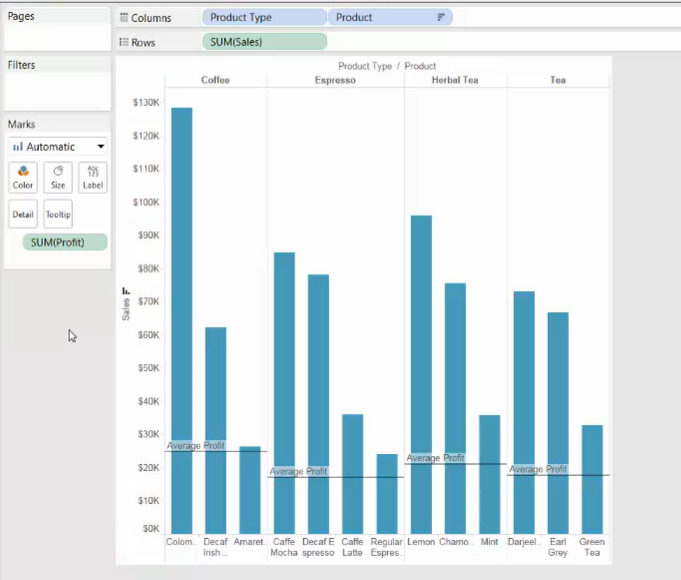
Right-click the axis --> Add Reference Line
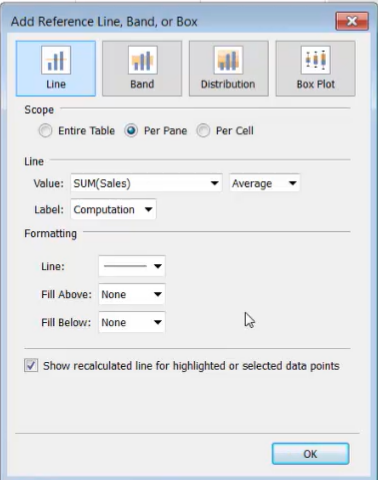
* [Line] --> [Value] only displays the measures in our view
-
-
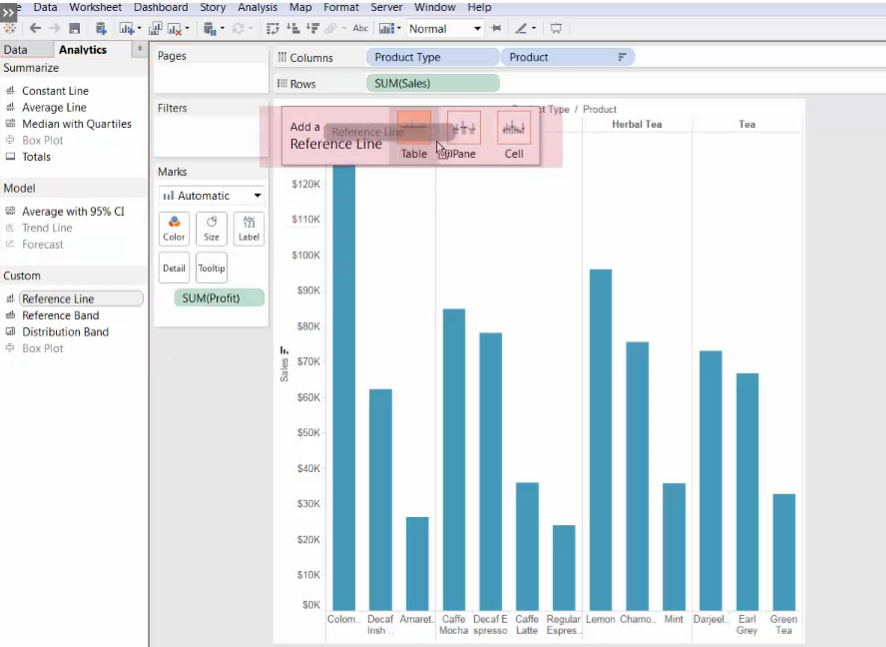
From the Analytics pane
-
Analytics --> Drag [Reference Line] to the view
-
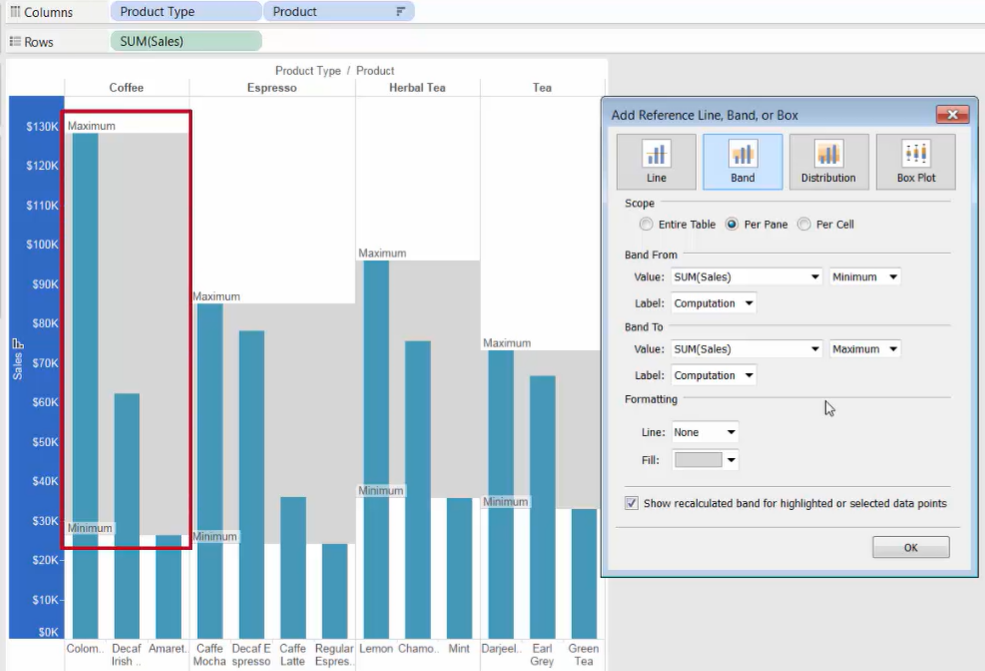
>> Reference Band
Reference Bands
- display data that falls within a certain window value
- and display as shaded areas between two constant or computed values
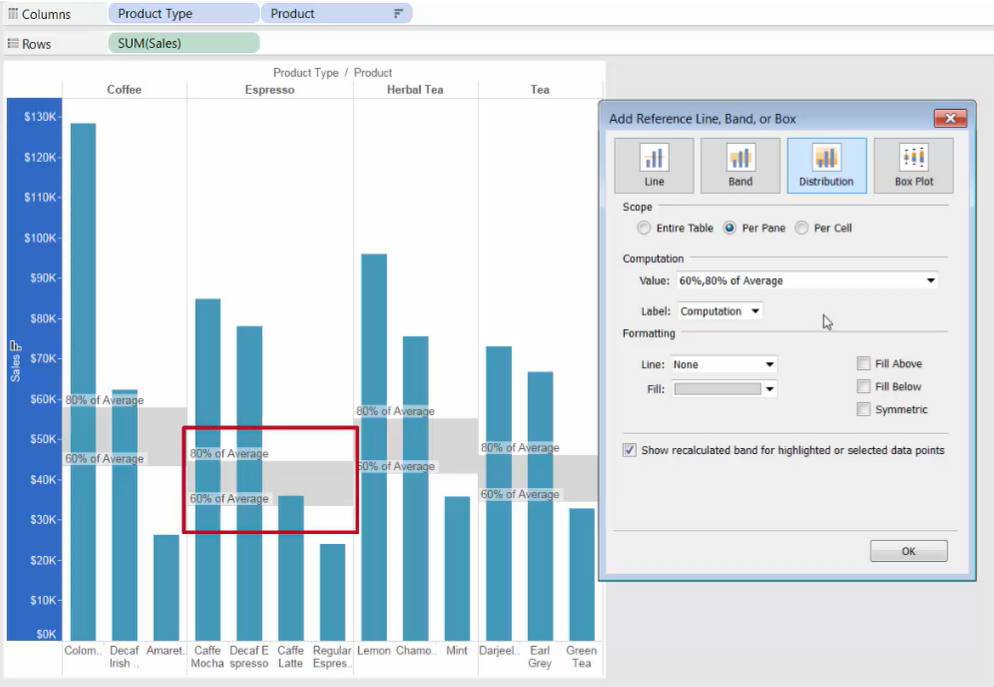
>> Reference Distribution
Reference Distributions
- are a variation of reference Bands
- It adds a gradient of shading to indicate the distribution of values along the axis
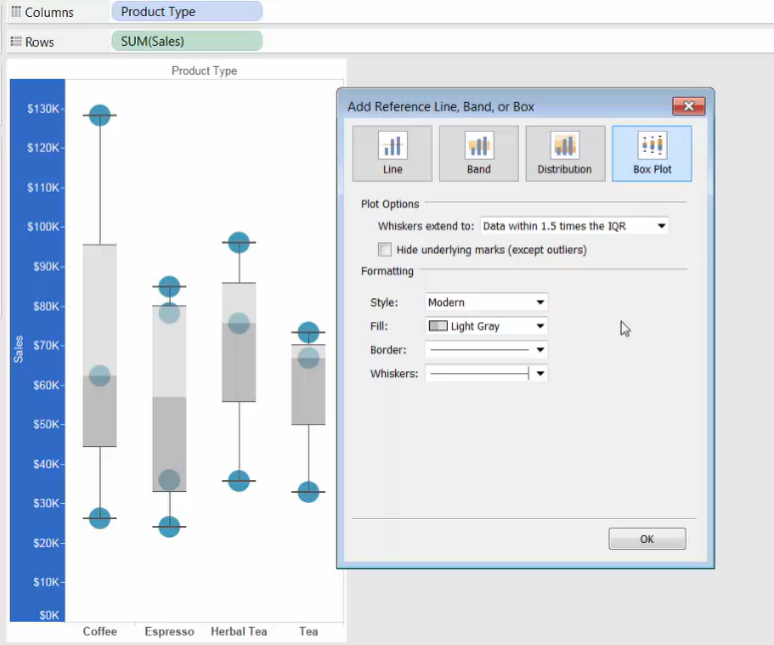
>> Reference Box Plot
Reference Box Plots describe the distribution of values along the axis