Create Dashboards and Stories
- 1. Plan for a Successful Dashboard
- 2. Creating a Dashboard
- 3. Creating Interactive Dashboards Using Actions
- 4. Refining a dashboard
1. Plan for a Successful Dashboard
>> Considerations for planning a dashboard
-
Who is your audience?
- determine which chart to use
- how you arrange the charts on the dashboard
- the level of detail
- the level of interaction
-
What information is important to your audience?
-
consider what the key takeaways are for your audience
-
simple and only includes relevant information
-
consistent design, language and color scheme
-
-
Why are you creating a dashboard?
- a conclusion or a key question?
- to inform your users?
- to explore the data?
-
Where is the dashboard going to be viewed?
- viewing on different size devices? (desktop, laptop, tablet, phone?)
- print the dashboard?
- look at offline?
>> Steps for planning a dashboard
Four General Steps
- Determine purpose + audience
- Plan the dashboard
- Build using design best practices
- Test it for usability and performance
2. Creating a Dashboard
>> Add views to a dashboard
-
Create a new dashboard
- click the [New Dashboard] icon

- click the [New Dashboard] icon
-
Add views to a dashboard
- drag the worksheet in the [Sheets] list to the canvas
-
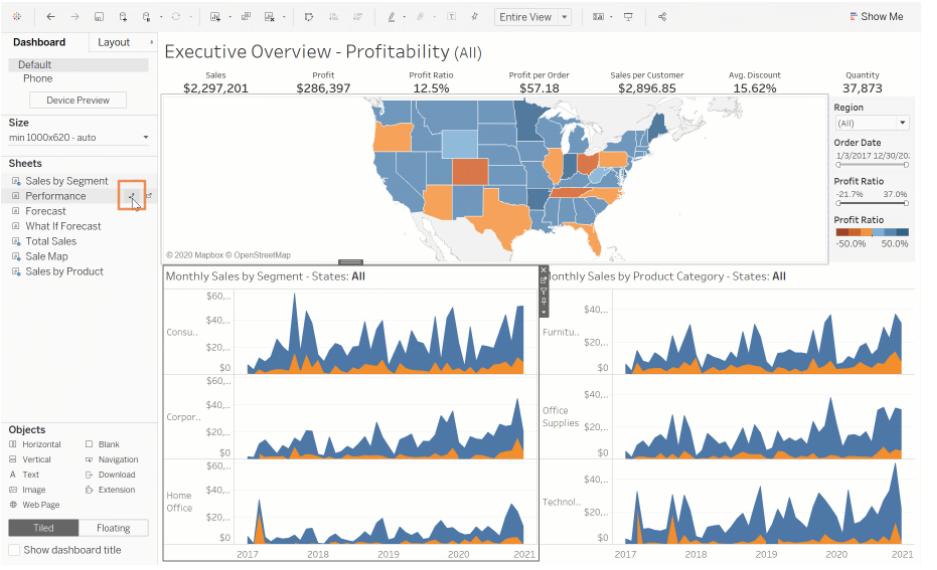
Replace one worksheet with another
-
select the worksheet in the dashboard view
-
in the [Sheets] list, hover over the title of the worksheet you would like to use and click the [Swap Sheets] icon
-
-
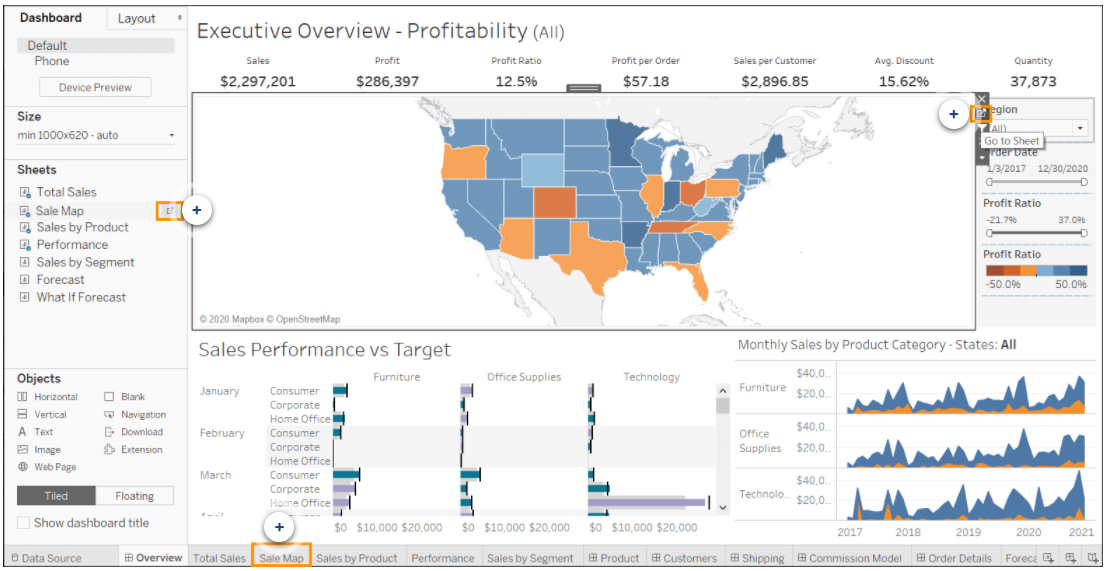
Return to worksheet in three ways
>> Dashboard Settings
-
Dashboard Panel
-
[Device Preview] : to see what your dashboard would look like on certain devices
-
[Size] : Fixed Size / Automatic / Range
-
[Sheets] : Sheet names of the views in this workbook that can be used to build your dashboard
-
[Objects] : containers, images, text or web pages that can be added to a dashboard
- Object layout: Tiled (arrange in a single layer grid) / Floating (freely moved on the dashboard)
-
[Show dashboard title]
-
-
Layout Panel
-
[Item hierarchy]
- contains all the floating objects and any tiled objects listed in a hierarchy
- selecting any object on the list will highlight it in the view
* containers framed in blue
* sheets framed in gray
-
[Settings] : adjust objects’ position and size
- tiled objects are fixed (can’t change the position or size)
-
>> Highlight and filter data in dashboards
-
Legend Highlights
- Legend highlights help the data to stand out from other marks
- activate: [Legend] Card --> select Highlight Selected Items
-
Use a view as a filter
- means the marks you select in one view will filter the results of the other views in your dashboard
-
Apply the filter to all sheets
-
filter card --> [Apply to Worksheets] --> [All using This Data Source]
-
3. Creating Interactive Dashboards Using Actions
>> Actions in Tableau
- Filter Action
- Using the data from one view to filter data in another
- Typically, a filter action sends information from a selected mark to another sheet showing related information
- Highlight Action
- Allow you to call attention to marks of interest by retaining color for specific marks and dimming all others
- Several methods to highlight marks
- Manually select the marks you want to highlight
- use the legend to select related marks
- use the highlighter to search for marks in context
- create an advanced highlight action
- Go to Sheet Action
- Navigation to other worksheets, dashboards, or stories
- Go to URL Action (Tableau Desktop Only)
- Create hyperlinks to external resources, such as a web page, email link, or a file
- Parameter and set actions (Tableau Desktop Only)
- Parameter actions: Let your audience change a parameter value through direct interaction with a viz
- Set actions: Let users change the values in a set by directly interacting with marks on a viz
>> Methods for running an action
- Hover
- Rest the mouse pointer over a mark to run the action
- Works well for highlight actions
- Select
- Click a mark to run the action
- Works well for most types of actions except URL actions
- Menu
- Click a selected mark --> select an option on the tooltip
- Works well for URL actions
>> Add actions to a dashboard
1. Filter Action
-
Concept:
-
Filter actions create a filter on a target sheet based on a selection at the source sheet
-
With filter action, you can use the data from one view to filter data in another
-
-
Caution: The filter chosen must in both the source and target sheets
-
Create a filter action:
-
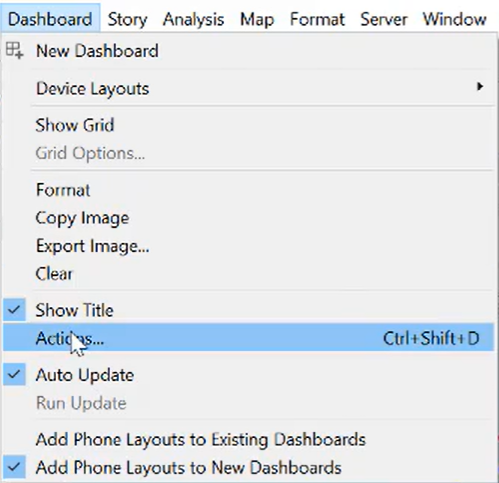
[Dashboard] --> [Actions]
-
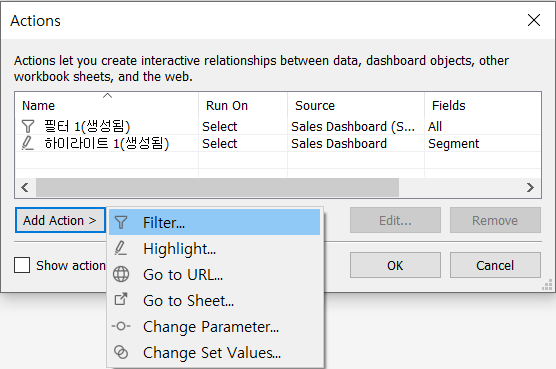
[Add Action] --> [Filter]
-
-
Edit a filter action:
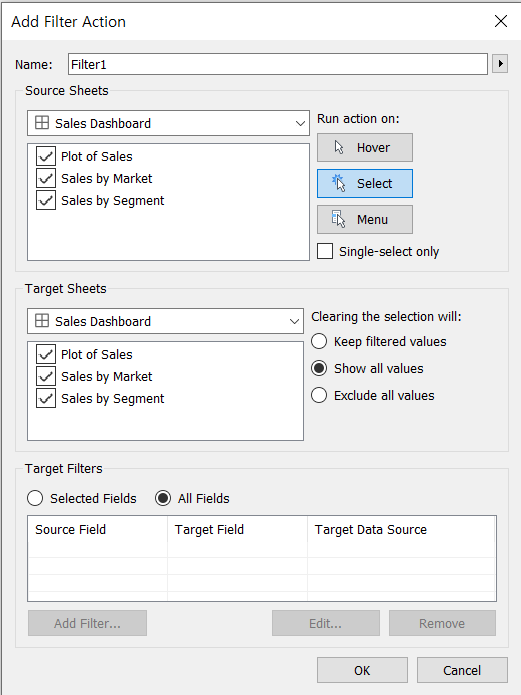
-
Filter Action Name
-
Source Sheets
-
Run action on: Hover / Select / Menu
-
Target Sheets
-
Clearing the selection will:
- Leave the filter: the filter stay in place until the next selection
- Show all values: returns the view to an unfiltered state
- Exclude all values: remove the marks and axes of target sheets from the view
-
Target Filters:
- select specific fields to respond to this filter action
- let all fields respond to this filter action
-
2. Highlight Action
-
Concept: Highlight actions are used to call attention relevant data by retaining color for some marks while dimming all the others
-
Create a highlight action:
-
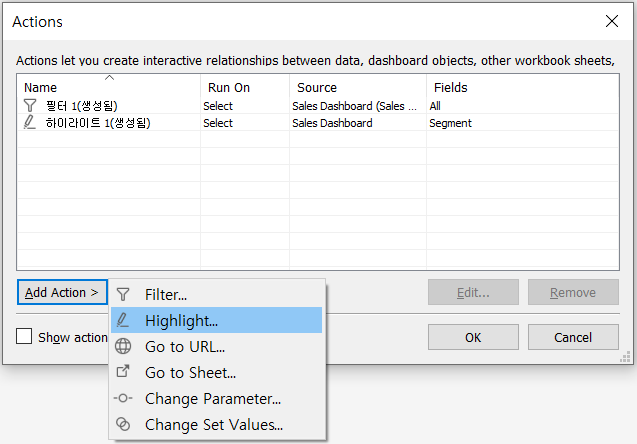
[Dashboard] --> [Actions]

-
[Add Action] --> [Highlight]
-
-
Edit a highlight action:
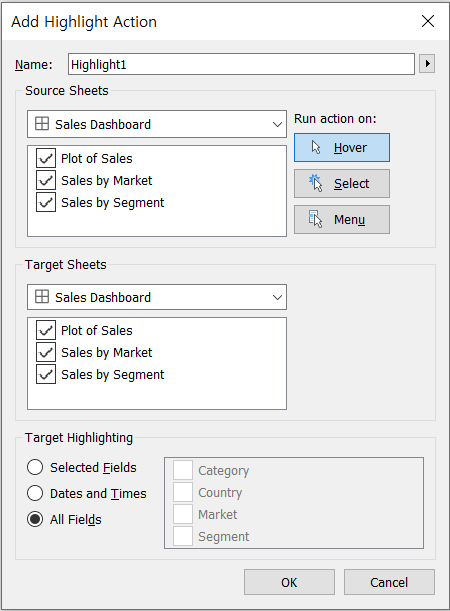
- Highlight Action name
- Source Sheets
- Run action on: Hover / Select / Menu
- Target Sheets
- Target Highlighting: the types of fields that will be highlighted
- Selected Fields
- Dates and Times
- All fields
3. Go to Sheet Action
-
Concept: The Go to Sheet action allows users to go from one dashboard to another sheet or dashboard.
-
Create a Go to Sheet action:
- [Dashboard] – > [Actions]
- In the [Actions] dialog box, [Add Action] --> [Go to Sheet]
-
Edit a Go to Sheet action
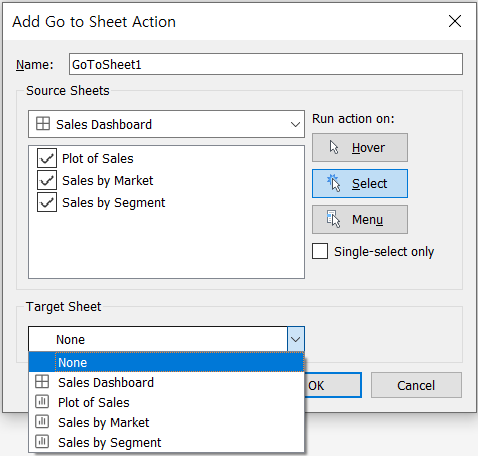
- Go to Sheet action name
- Source Sheets
- Run action on: Hover / Select / Menu
- Target Sheets
4. Go to URL Action
-
Concept: URL actions allow end users to connect to web-based resources, and these can by dynamically programmed to update based on the user’s selection.
-
Create a Go to URL action:
- [Dashboard] --> [Actions]
- In the [Actions] dialog box, [Add Action] --> [Go to URL]
-
Edit a Go to URL action:
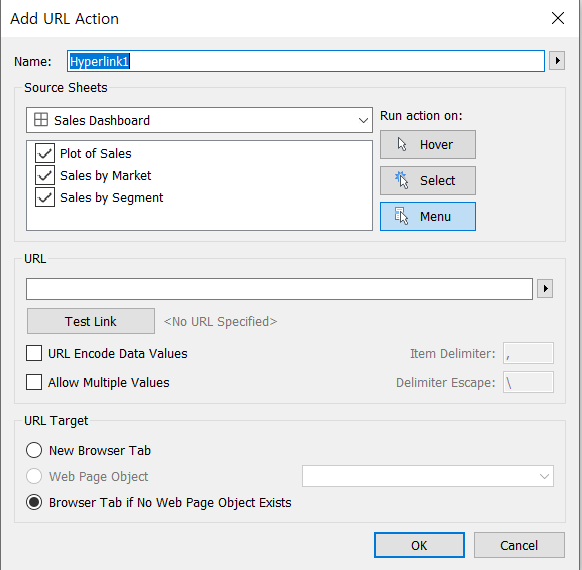
- Go to URL Action name
- Source Sheets
- Run action on: Hover / Select / Menu
- URL: with an ftp, http, or https prefix
- Arrow button at the right of the URL box: enter field and filter values as parameters in the URL
4. Refining a dashboard
>> Start with the layout
-
Select worksheets to include
-
Set the layout orientation with containers
- Horizontal layout container
- Vertical layout container
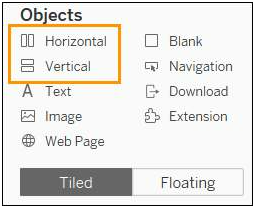 (More Info. : Size and Lay Out Your Dashboard)
 -
Use non-worksheet objects
- Text
- Image
- Web Page
- Navigation : Add a button that navigates to another dashboard or sheet
- Extension : Insert a dashboard extension
- Export : Add a button to allow dashboard consumers to export the dashboard according to the export type you determine (PDF, PowerPoint, or Image)
-
Consider Floating a view
- To save space or improve its proximity to another item, you can float a view, filter, legend, text, image, web page, or even a layout container
-
Add white space
-
Two methods:
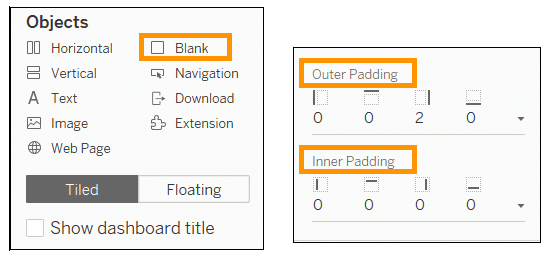
- Insert and resize a blank container
- Adjust either the outer or inner padding of a view, container, or object
-
Padding:
- [Inner Padding] : sets the spacing between item contents and the perimeter of the border and background color
- [Outer Padding] : provides additional spacing beyond the border and background color
-
-
Use borders and background colors sparingly
>> Determine the device layout (Tableau Desktop Only)
Step 1. Make a dashboard by using the default
- The default dashboard acts as a template for other device layouts
- Only sheets that are put onto the default dashboard will be available for the device specific layouts
Step 2. Add a device layout
-
[Dashboard] Pane --> click [Device Preview]
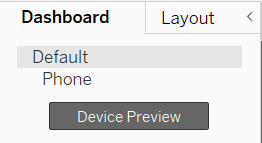
-
Choose a layout in [Device Preview Bar]:

- Device Type: Default / Desktop / Tablet / Phone
- Screen Orientation: Landscape (가로) / Portrait (세로)
-
click [Add ** Layout]
Step 3. Edit the layout added
-
Size
-
Default: keeps the size from the default dashboard
-
Fit all: fits all the dimensions like automatic sizing on the default
-
Fit width: fits the dashboard horizontally but allows a hard-coded height
(It means the user would scroll vertically to consume the entire dashboard)
-
-
Layout
- Default
- Custom : Available to edit
>> Color, sizing and fonts
-
Color
-
Sizing
- Keep users’ screen size in mind
- When using crosstabs, don’t use Fit Entire View; use a combination of a scroll bar and either Fit Width or Fit Height
- To resize elements, try Shift+drag
- To resize individual worksheets, use CTRL and the arrow keys to resize rather than manually dragging
-
Font
-
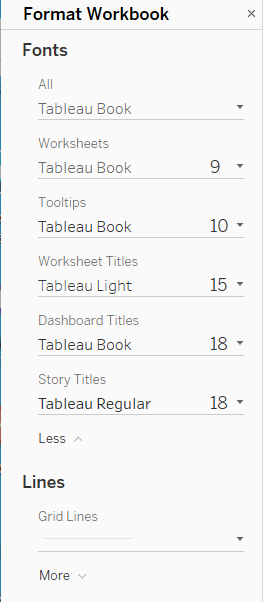
The quickest way to make a fast, large-scale change to all the titles in your dashboard is to change them at the workbook level (A workbook is the largest possible container for formatting settings) :
-
Click [Format] --> Select [Workbook]
-
Edit in [Format Workbook] Pane --> [Fonts]

-
-
>> Tooltips
-
Customize tooltips:
- [Worksheet] --> [Tooltip]
-
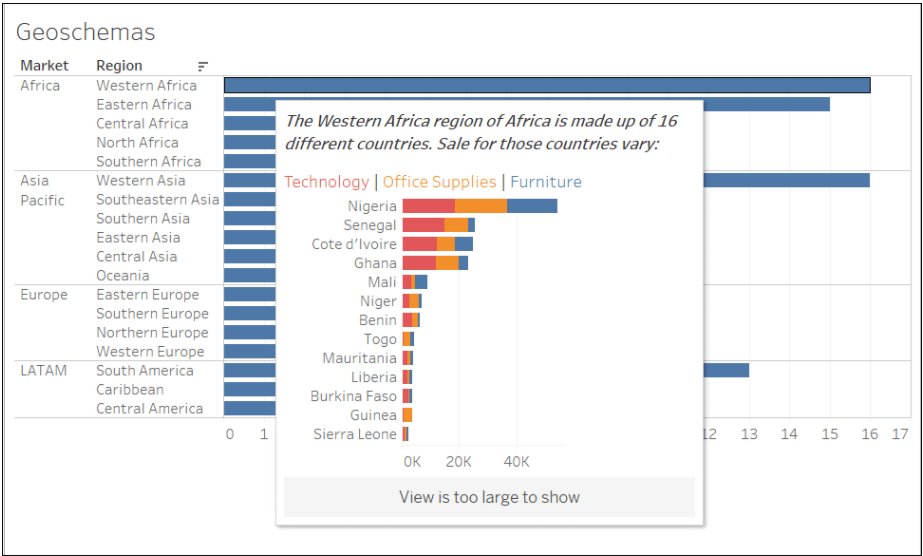
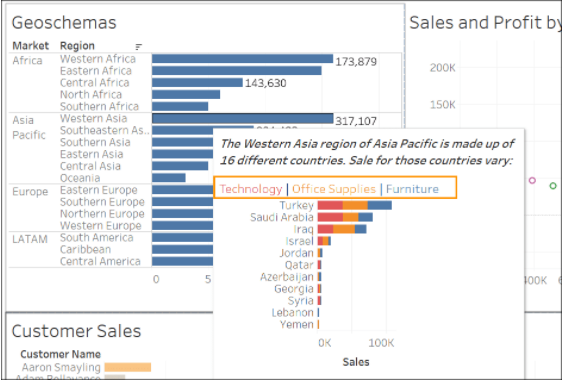
Add visualizations in tooltips
-
Viz in tooltips:
-
Add a viz in tooltip
-
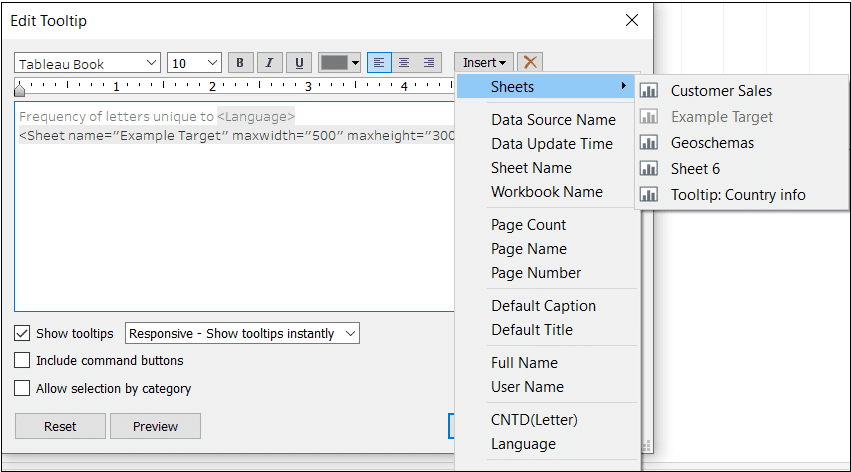
From the main (source) viz, click [Tooltip] on the [Marks] card.
-
Click [Insert] --> [Sheets]
-
Select the target sheet that should appear in the tooltip --> click [OK]
-
-
Learn more
-
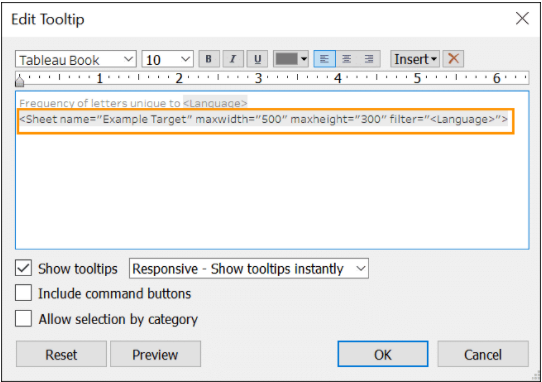
You can set the size of a view in a tooltip
-
The view in the tooltip is always static
- The viz in the tooltip is a static image, not an interactive viz.
- Multiple target sheets can appear in the same tooltip
-
It’s possible to format tooltip text
-
Hovering on a mark filters the target viz
- On the sheet for the target viz, there is a “tooltip” filter on the [Filters] shelf
- When a tooltip containing a viz is displayed, the target viz is filtered based on the mark you’re hovering over
-
Show Me resets the tooltip
- If you use [Show Me] in the source sheet to change the view structure, you will reset all tooltip edits, including Viz in Tooltip references.
-
-
