Advanced Mapping
1. Modifying Locations
>> Edit errors in geocode data
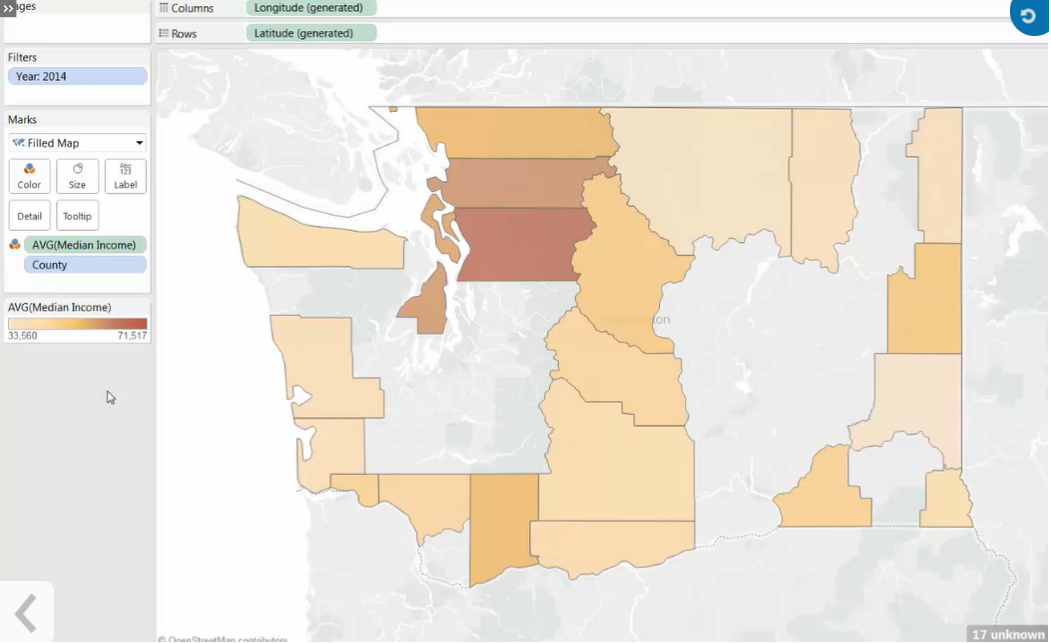
[Problem] Not all the counties are shown in the map
-
Error: [Ambiguous] : same counties in other states have the same names
-
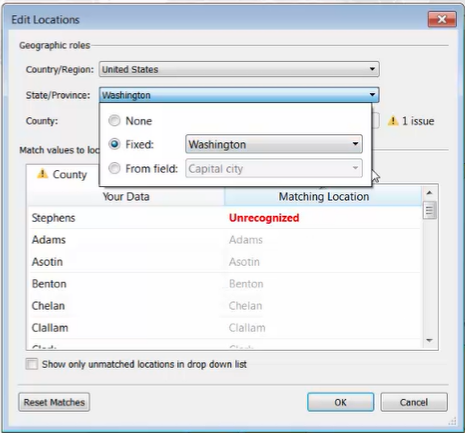
Error: [Unrecognized] : typos (spelling errors)
[Fix the problems]
-
Fix the ambiguous errors
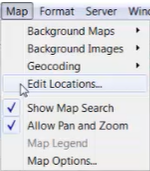
- [Map] menu --> [Edit Locations]
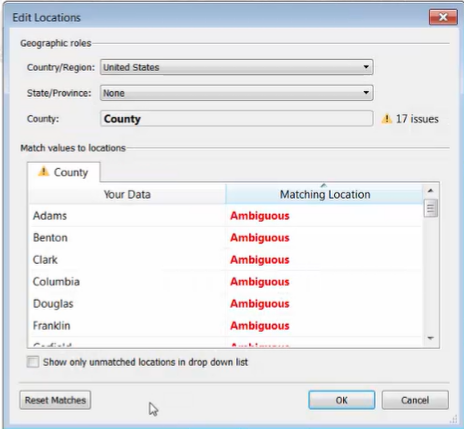
- Fix the state to Washington
-
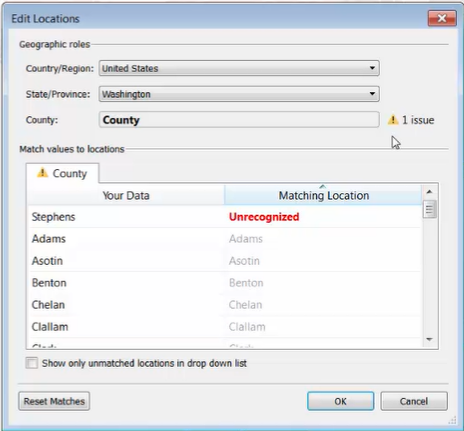
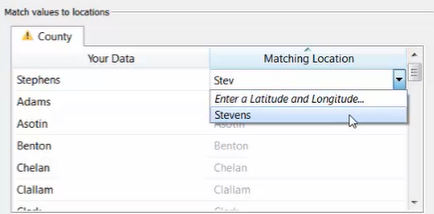
Fix the typos (spelling errors)
-
[Edit Locations] dialog box
-
click the error and type the correct spelling
-
>> Assign locations to data
[Mission] Add the location of each region’s corporate headquarters
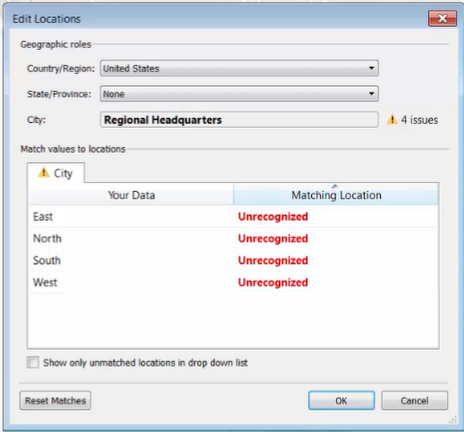
[Problem] Values in the field are North, South, East, and West, which Tableau doesn’t have a default location for.
[Fix the problem] – Add specific locations
-
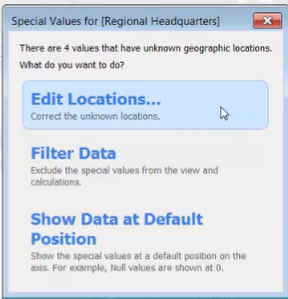
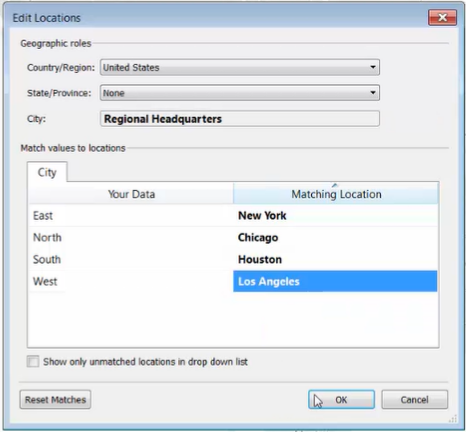
Select the warning box --> Select [Edit Locations]

-
match the data to specific values (match our regions to specific cities)
-
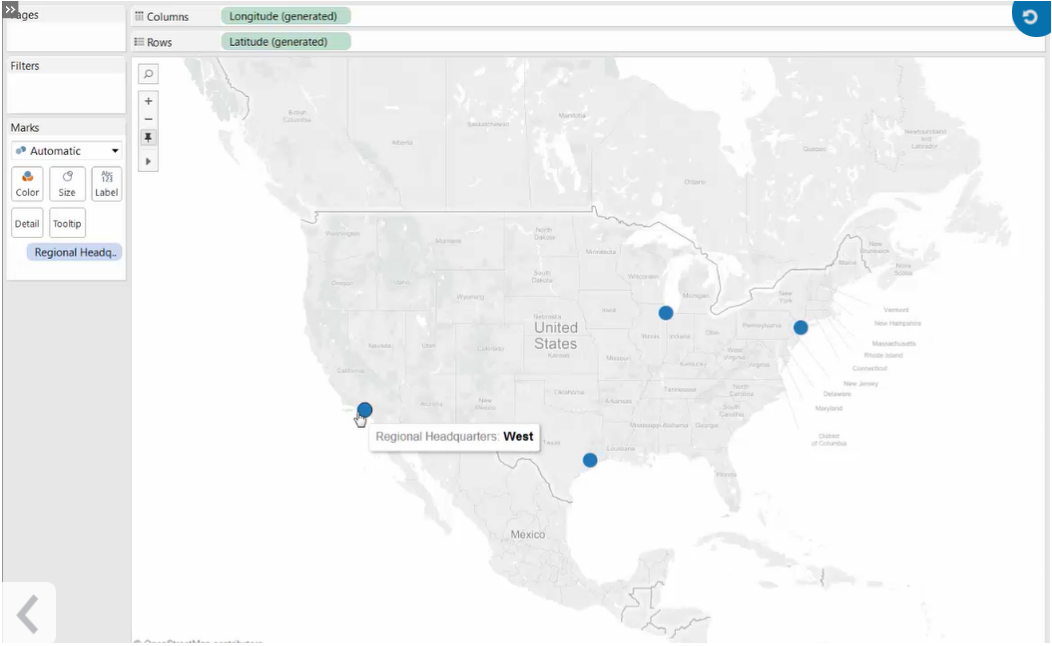
Problem fixed
2. Customizing Geocodes for Addresses
When there are geographic fields that Tableau doesn’t recognize, you can assign your own Custom Geocodes to map your data.
[Mission] Map the various tour sites located around the city
[Problem] Tableau cannot recognize Street Address as geographic data
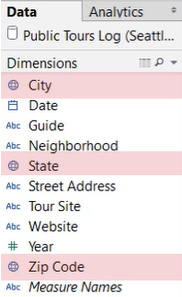
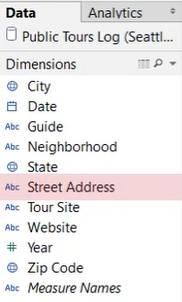
[Fix the problem] Custom geocode addresses by matching a street address to a specific latitude and longitude coordinate
-
Generate the latitude and longitude coordinate with address using a batch geocoding website
-
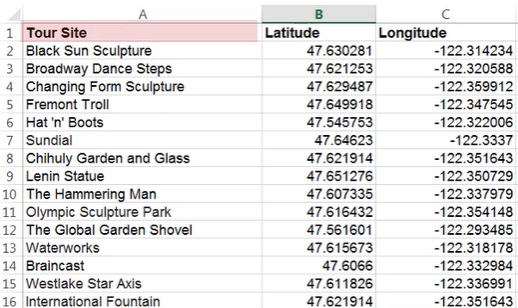
Create an excel spreadsheet (named as “Geocoded addresses”) which contains each Tour Site along with its matching latitude and longitude coordinate
-
Add the data source “Geocoded addresses”
-
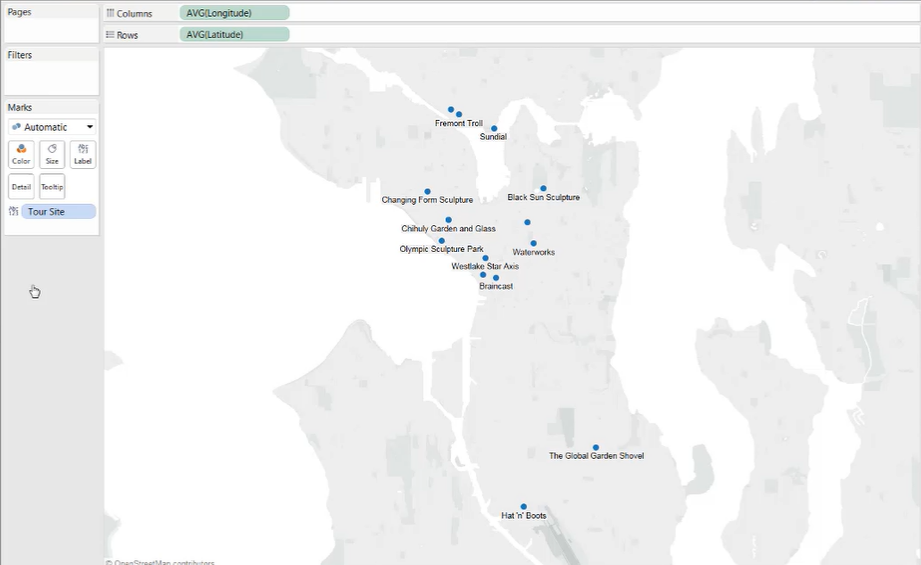
[First] Start with the “Geocoded addresses” data source:
-
[Rows] : Latitude
[Columns] : Longitude
-
[Label] : [Tour Site]
-
-
[Second] Switch to the original data source:
-
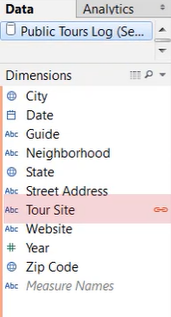
blend two data sources with the common field [Tour Site]
-
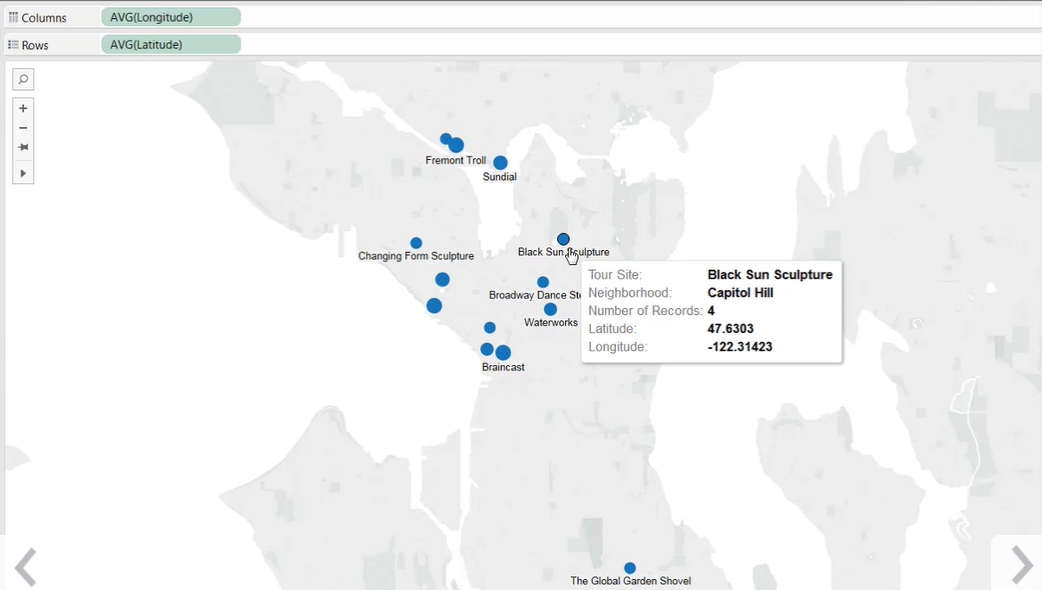
[Size] : [Number of Records]
-
-
Add streets and highways into the map
-
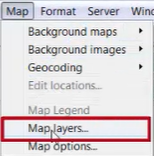
[Map] menu --> [Map layers]
-
check the [Streets and Highways]

-
3. Using a Background Image
We can use an background image and X/Y coordinates to show locations on a map
[Mission] Create an interactive map that shows the location of meeting rooms and their seating capacity in a company’s building
- Add a background image of an office layout, and
- Then plot the meeting room data on top of it
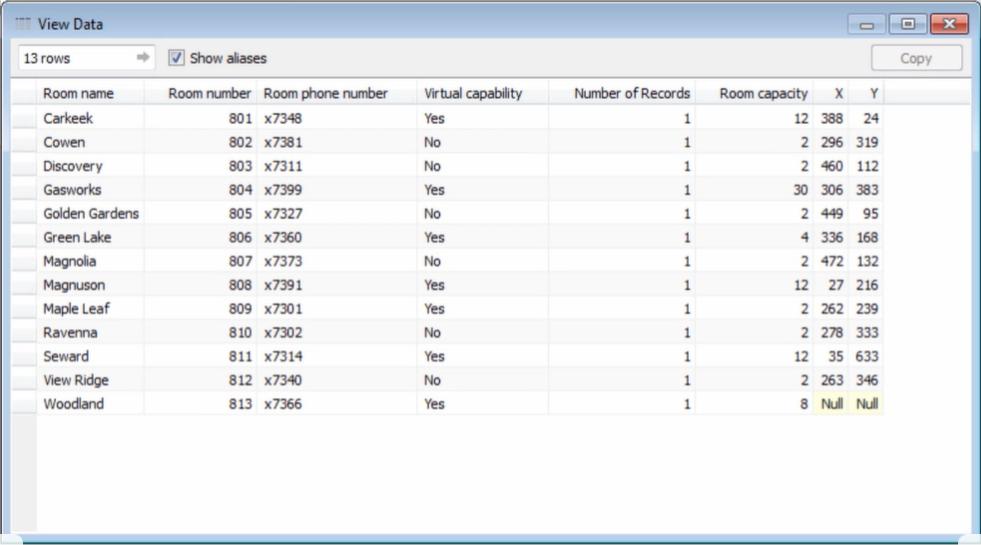
[Data]
- Room information and X / Y coordinates for each room
- Contains no X / Y coordinate values (NULL) for the room Woodland
[Process]
-
Add [X] to [Columns]
Add [Y] to [Rows]
remove axis
-
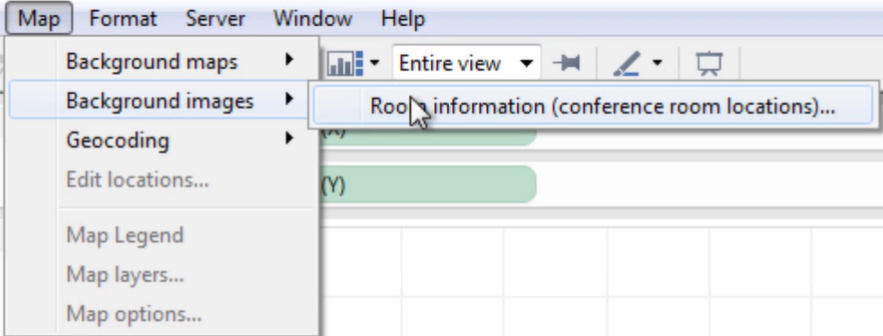
Add the background image
-
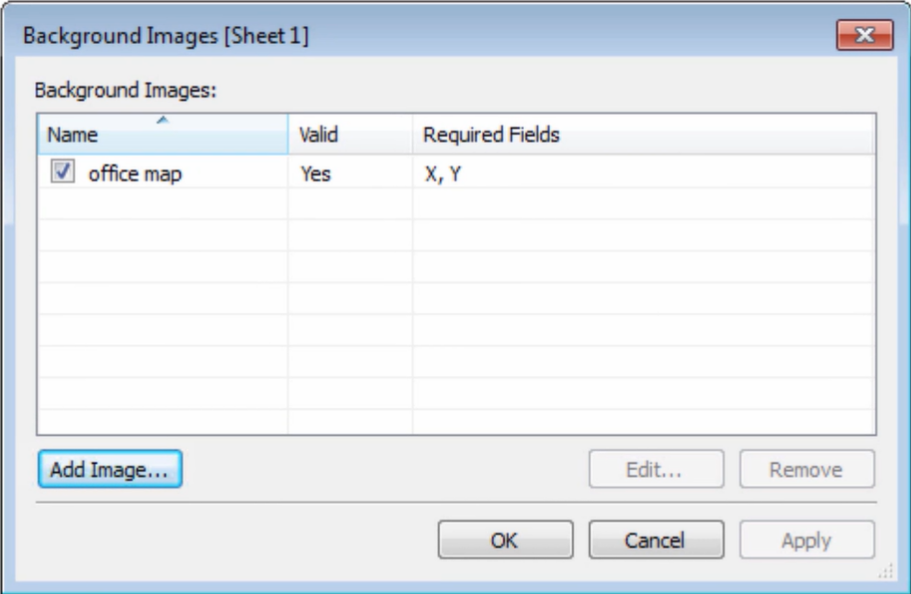
[Map] menu --> [Background images] --> Data source name
-
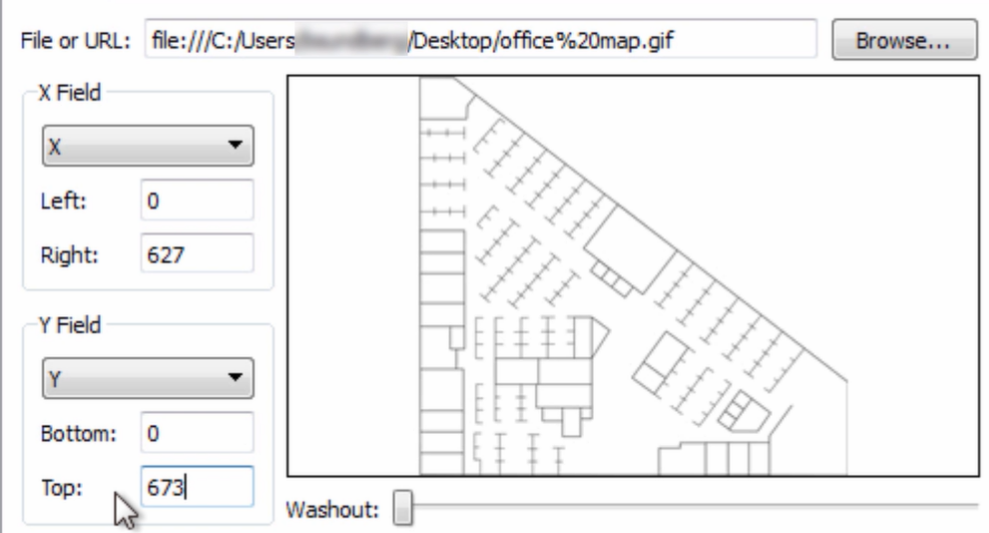
Add Image
- X Field: Left – 0, Right – 627 (pixels value)
- Y Field: Right – 0, Left – 673 (pixels value)
-
-
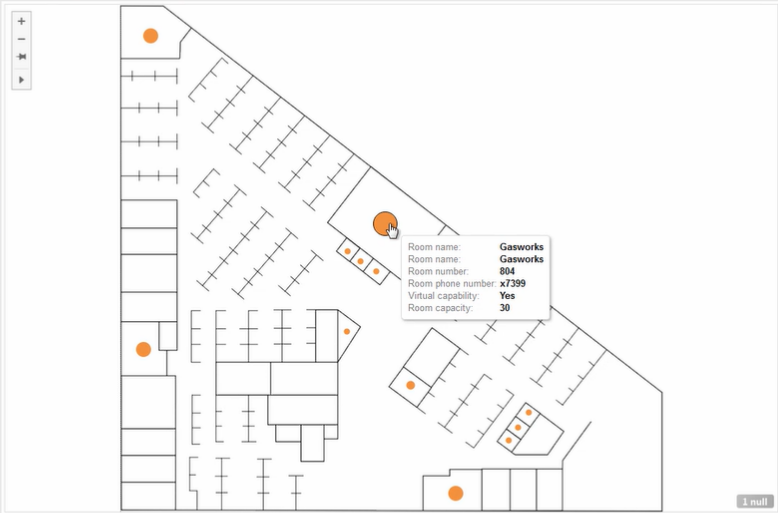
Drag [Room Name] to [Detail]
Drag [Room Capacity] to [Size]
Set [Tooltip]
-
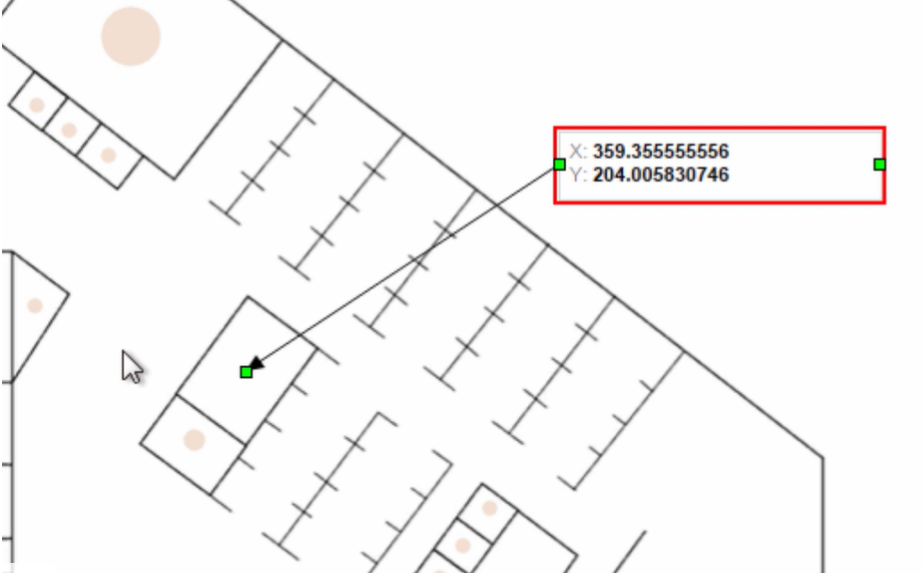
Deal with the NULL data
-
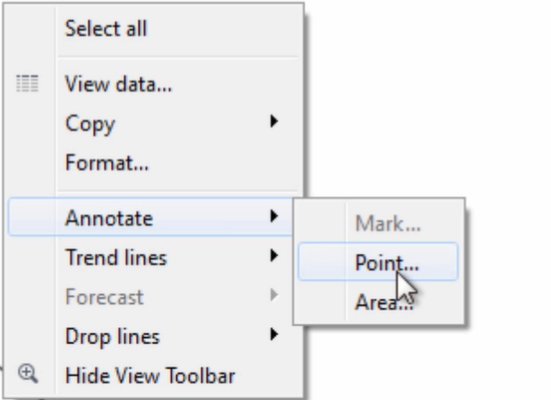
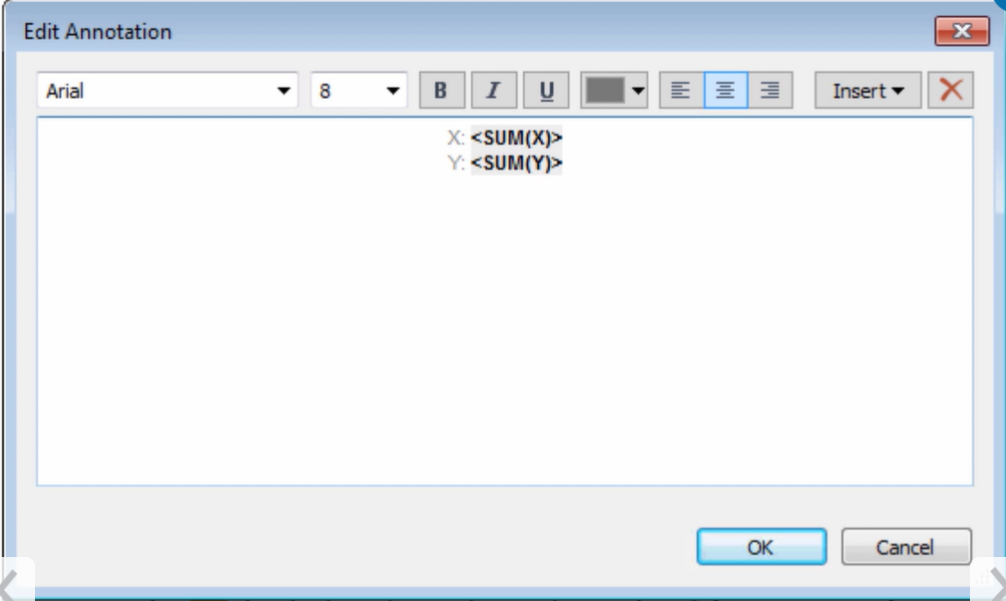
Right-click anywhere on the view --> [Annotate] --> [Point]
-
Drag the annotation to the location of Room Woodland
-
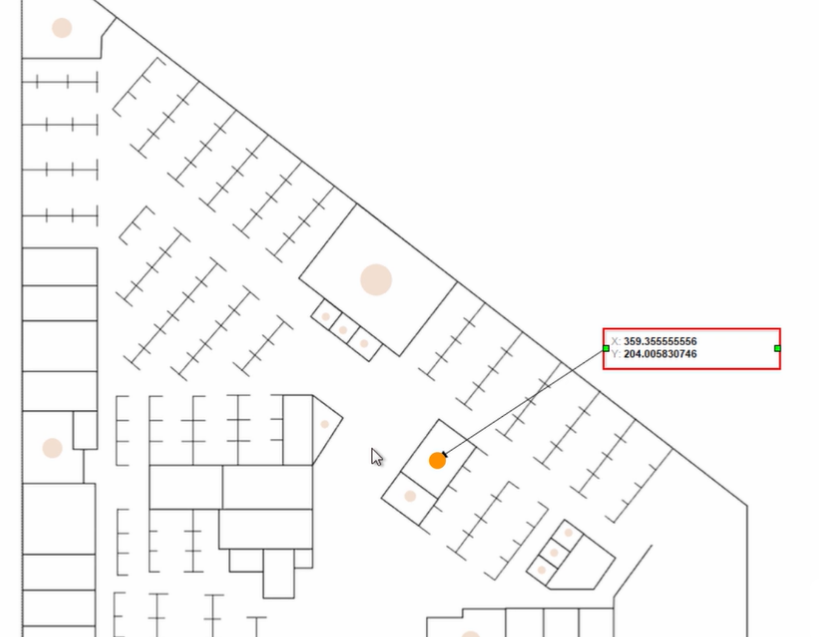
Update the room information file with Room Woodland’s X / Y coordinates
-
Refresh the data source connection in Tableau by pressing F5
-
Delete the annotation (coordinate tool) by selecting it and pressing the Delete key on the keyboard
-
