Viewing Distribution
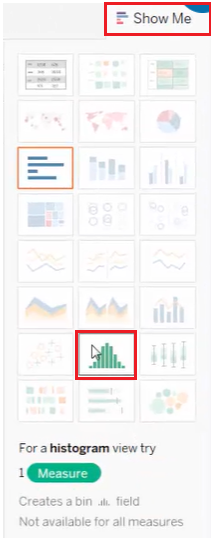
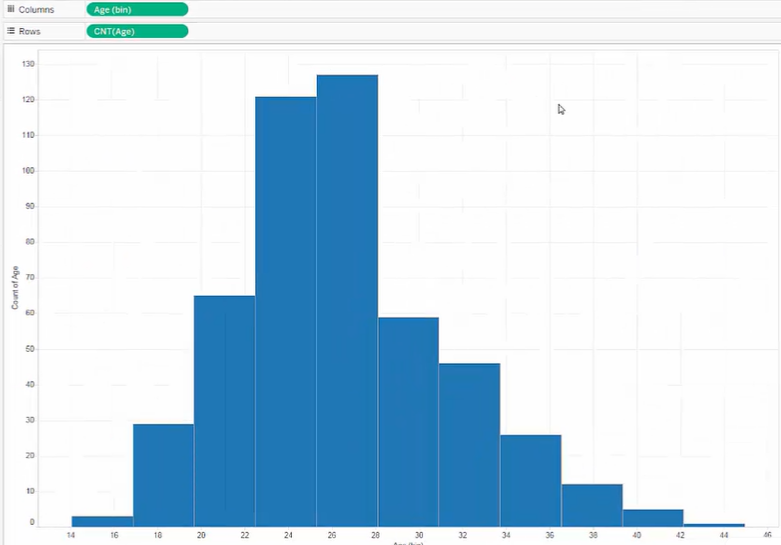
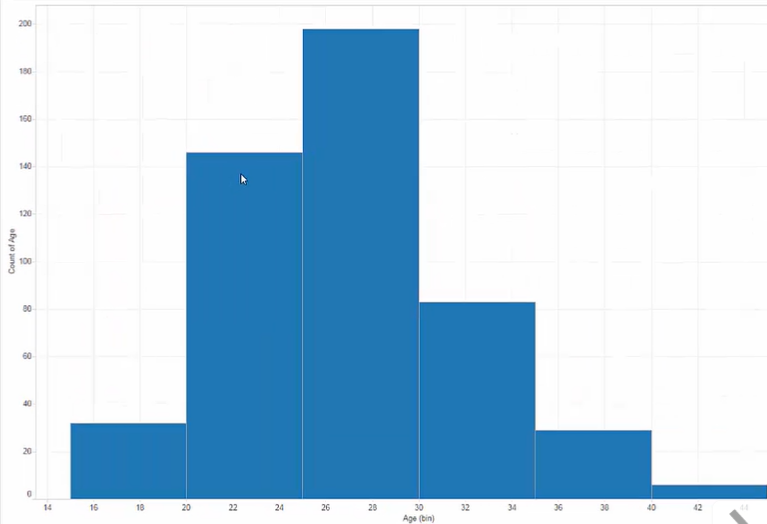
1. Building Histograms
>> Methods to create histograms
[Method 1] : Use Show Me
- Select [Measure] field --> click [Show Me] --> click the histogram thumbnail
-
Edit bins : Right-click [Age (bin)] --> [Edit]
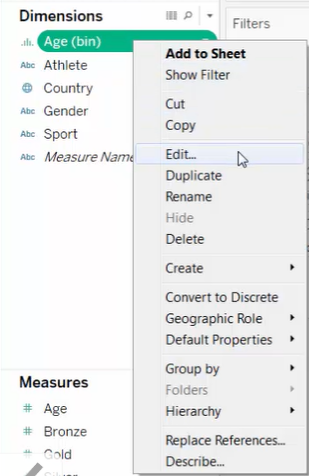
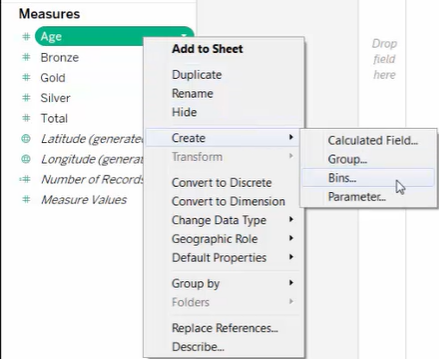
[Method 2] : In the Data pane
-
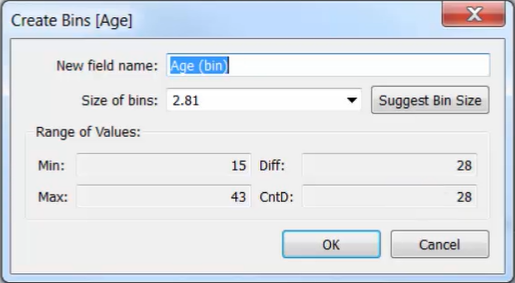
Right-click [Measure] field --> select [Create] --> select [Bins] --> edit bins --> click [OK]
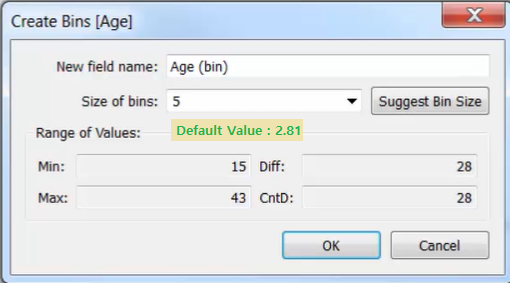
-
Size of bins: Default value – Tableau suggested size
-
Bin range:
- [a, b) a<= x < b
- For a bin size of 5, on data starting at 0:
[0, 4] – [5, 9] – [10, 14] … / [0, 5) – [5, 10) – [10, 15) …
-
-
Binning a measure creates a dimension : [Age (bin)]
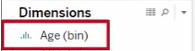
-
Build the view:
-
Drag [Age] to [Rows]
-
Drag [Age (bin)] to [Columns]
-
Change the aggregation of [Age] from Sum to Count
Change [Age (bin)] into continuous field [Age (bin)]
-
-
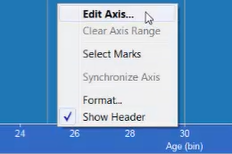
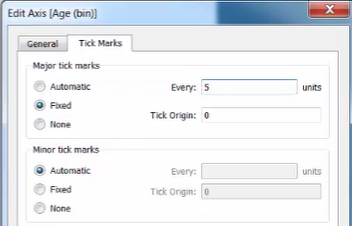
Fix the tick marks to the bin size
-
Right-click the x-axis --> click [Edit Axis]
-
[Tick Marks] Tab --> [Major tick marks] --> [Fixed] --> [Every] : (size of bins)
-
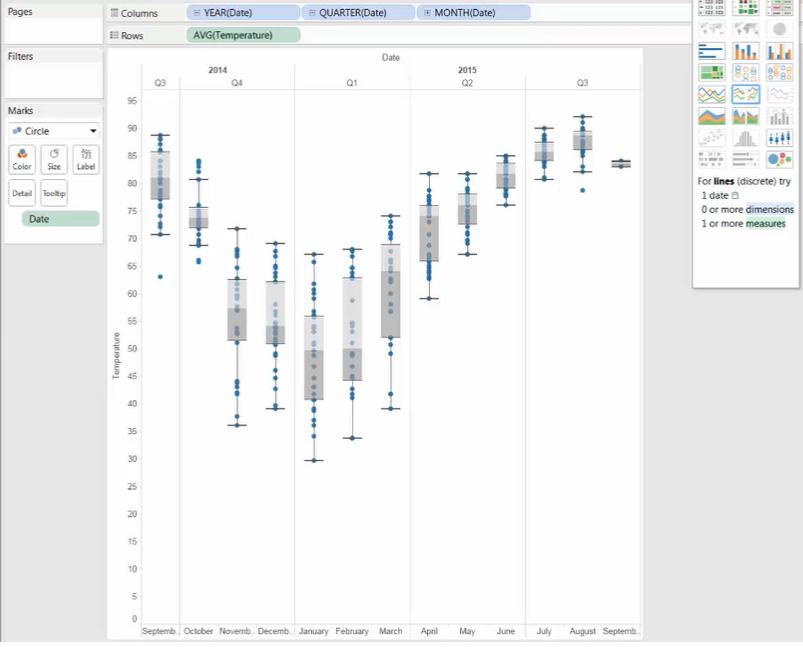
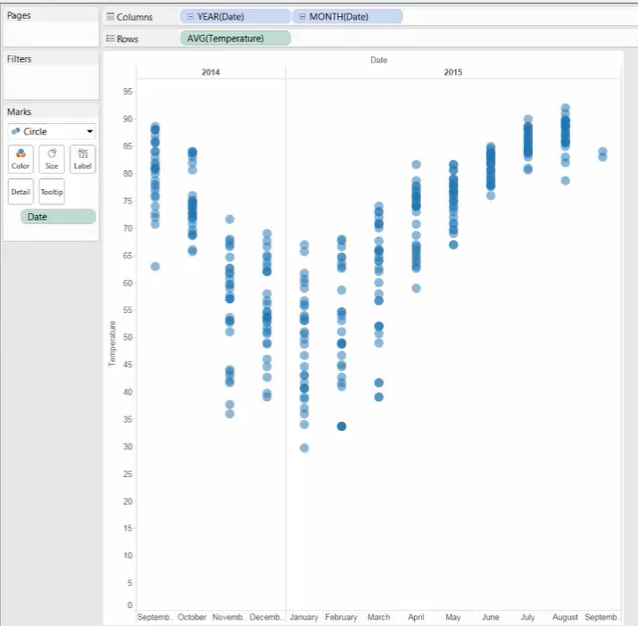
2. Building Box and Whisker Plots
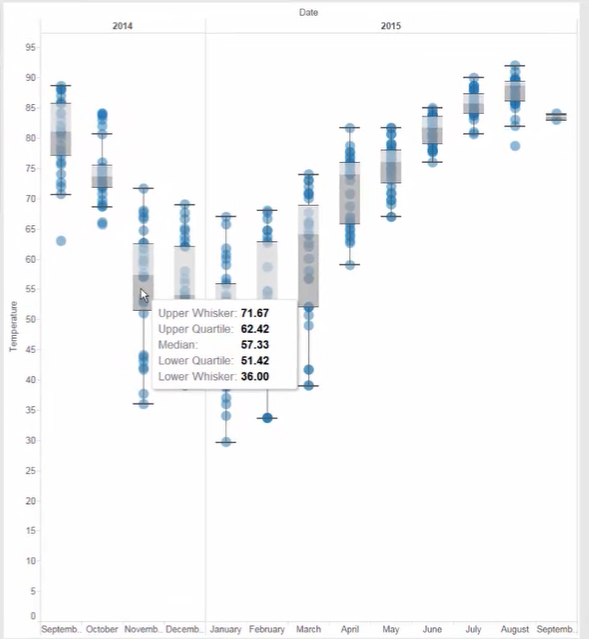
>> Box Plot
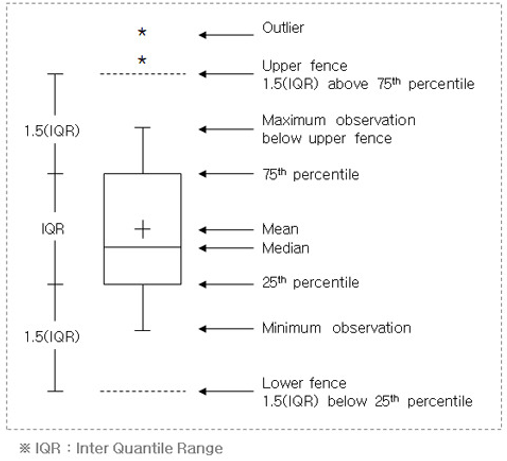
-
IQR: Q3 - Q1
Upper fence: Q3 + 1.5 * IQR
Lower fence: Q1 - 1.5 * IQR
-
The bottom and top whiskers are not always the same length:
the whiskers will show the last data point that is within the 1.5*IQR
>> Methods to create box plot
[Method 1] In the Data pane
-
[Columns] : [Dimension] field
[Rows] : [Measure] field
[Details] : [Dimension] field
-
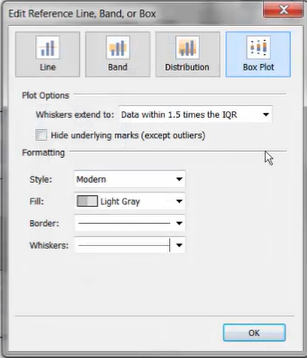
[Analytics] Pane --> Drag [Box Plot] to the view --> [Cell]
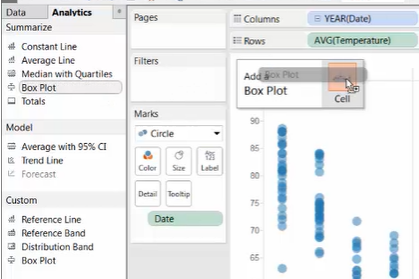
-
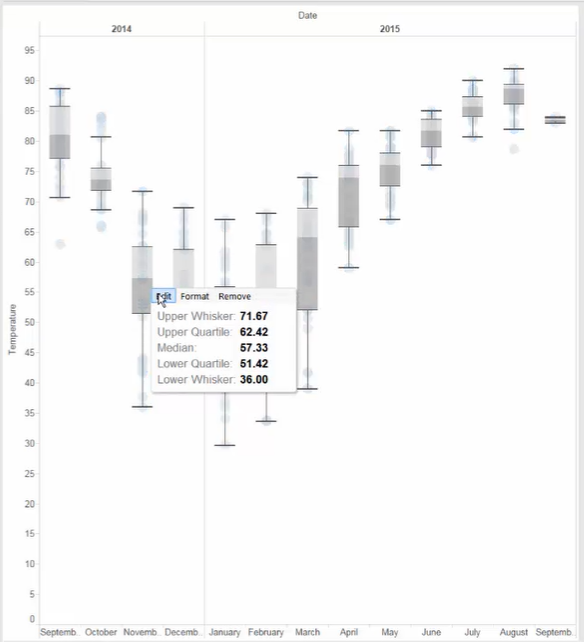
Edit the box plot
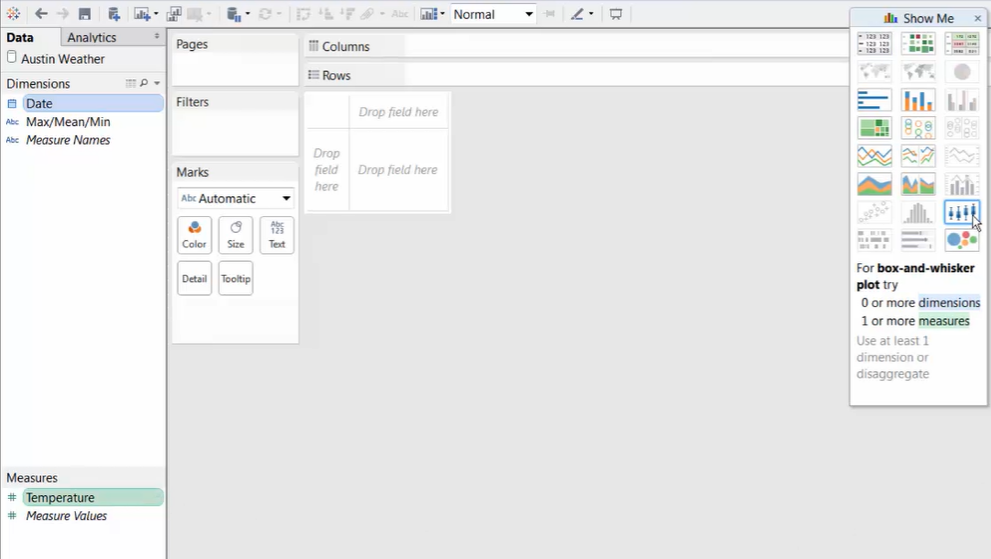
[Method 2] : Use Show Me
- Hold [Ctrl] and select [Dimension] field and [Measure] field
- [Show Me] --> click the box and whisker icon
-
Using the Marks card to adjust the formatting
- Mark Type : Circle
- Size & Color